What can Twitter really tell you about the stock market?
Date: 2020-08-11
Source: Arabesque
By Dr. Mabelle Chen
Hi there! I'm Mabelle and I'm an AI Researcher at Arabesque AI working in research and development. I specialise in Natural Language Processing (NLP), and spend most of my research time on analysing social media data. During my PhD, I extracted discrete emotions from historical tweets and used them to identify Twitter users at risk of depression. At Arabesque AI, I now focus on how we can estimate future stock price movements using Twitter data. In this post, I will walk you through how this could be achieved, using Twitter data for an anonymised company.
With the revolutionary growth of social media, the use of big data has become the latest trend for researchers analysing stock market movements. Using techniques from NLP, sentiment analysis has been the dominant method of extracting features from such data sources. A quick search of "stock market prediction Twitter" on Google Scholar will show that 9 out of 10 papers have either "sentiment analysis" or "mood" in the title, demonstrating a ubiquity of sentiment analysis in NLP applications. See for example Bollen et al. (2011), Mittal et al. (2011), Yu et al. (2012), Nguyen and Shirai (2015), and Sahana et al. (2019). The concept of using sentiment analysis to predict stock price movements has its origins in behavioural economics. According to Nofsinger (2010), the level of optimism or pessimism in a society affects the decisions made by consumers, investors, and corporate managers. This has an influence on aggregate investment and business activity, which suggests social mood can help gauge future financial and economic activities. Hence, many researchers seek to predict the movement of the market using the dynamics of companies, economic scenarios, and public moods.
However, is sentiment the only meaningful feature that one can extract from such data? The answer is definitely no. In this post, I explore what other information and features can be extracted from tweets and how effective these additional features are, in conjunction with sentiment, for estimating future stock price movements.
This blog is split into four sections:
- Features: I start by introducing a number of features that can be extracted from Twitter data and align to these three categories:
- Basic Features
- Twitter Platform Features
- Content-based Features
- Prediction: I then experiment with these features to assess how they can be used to predict the movement of four stock targets.
- Explanation: Next, I use model interpretation to examine how these features contribute to each prediction task.
- Conclusion: Finally, I share my conclusion of how platform-specific and content-based features perform, in comparison with sentiment.
Features: So, what can we really measure from tweets?
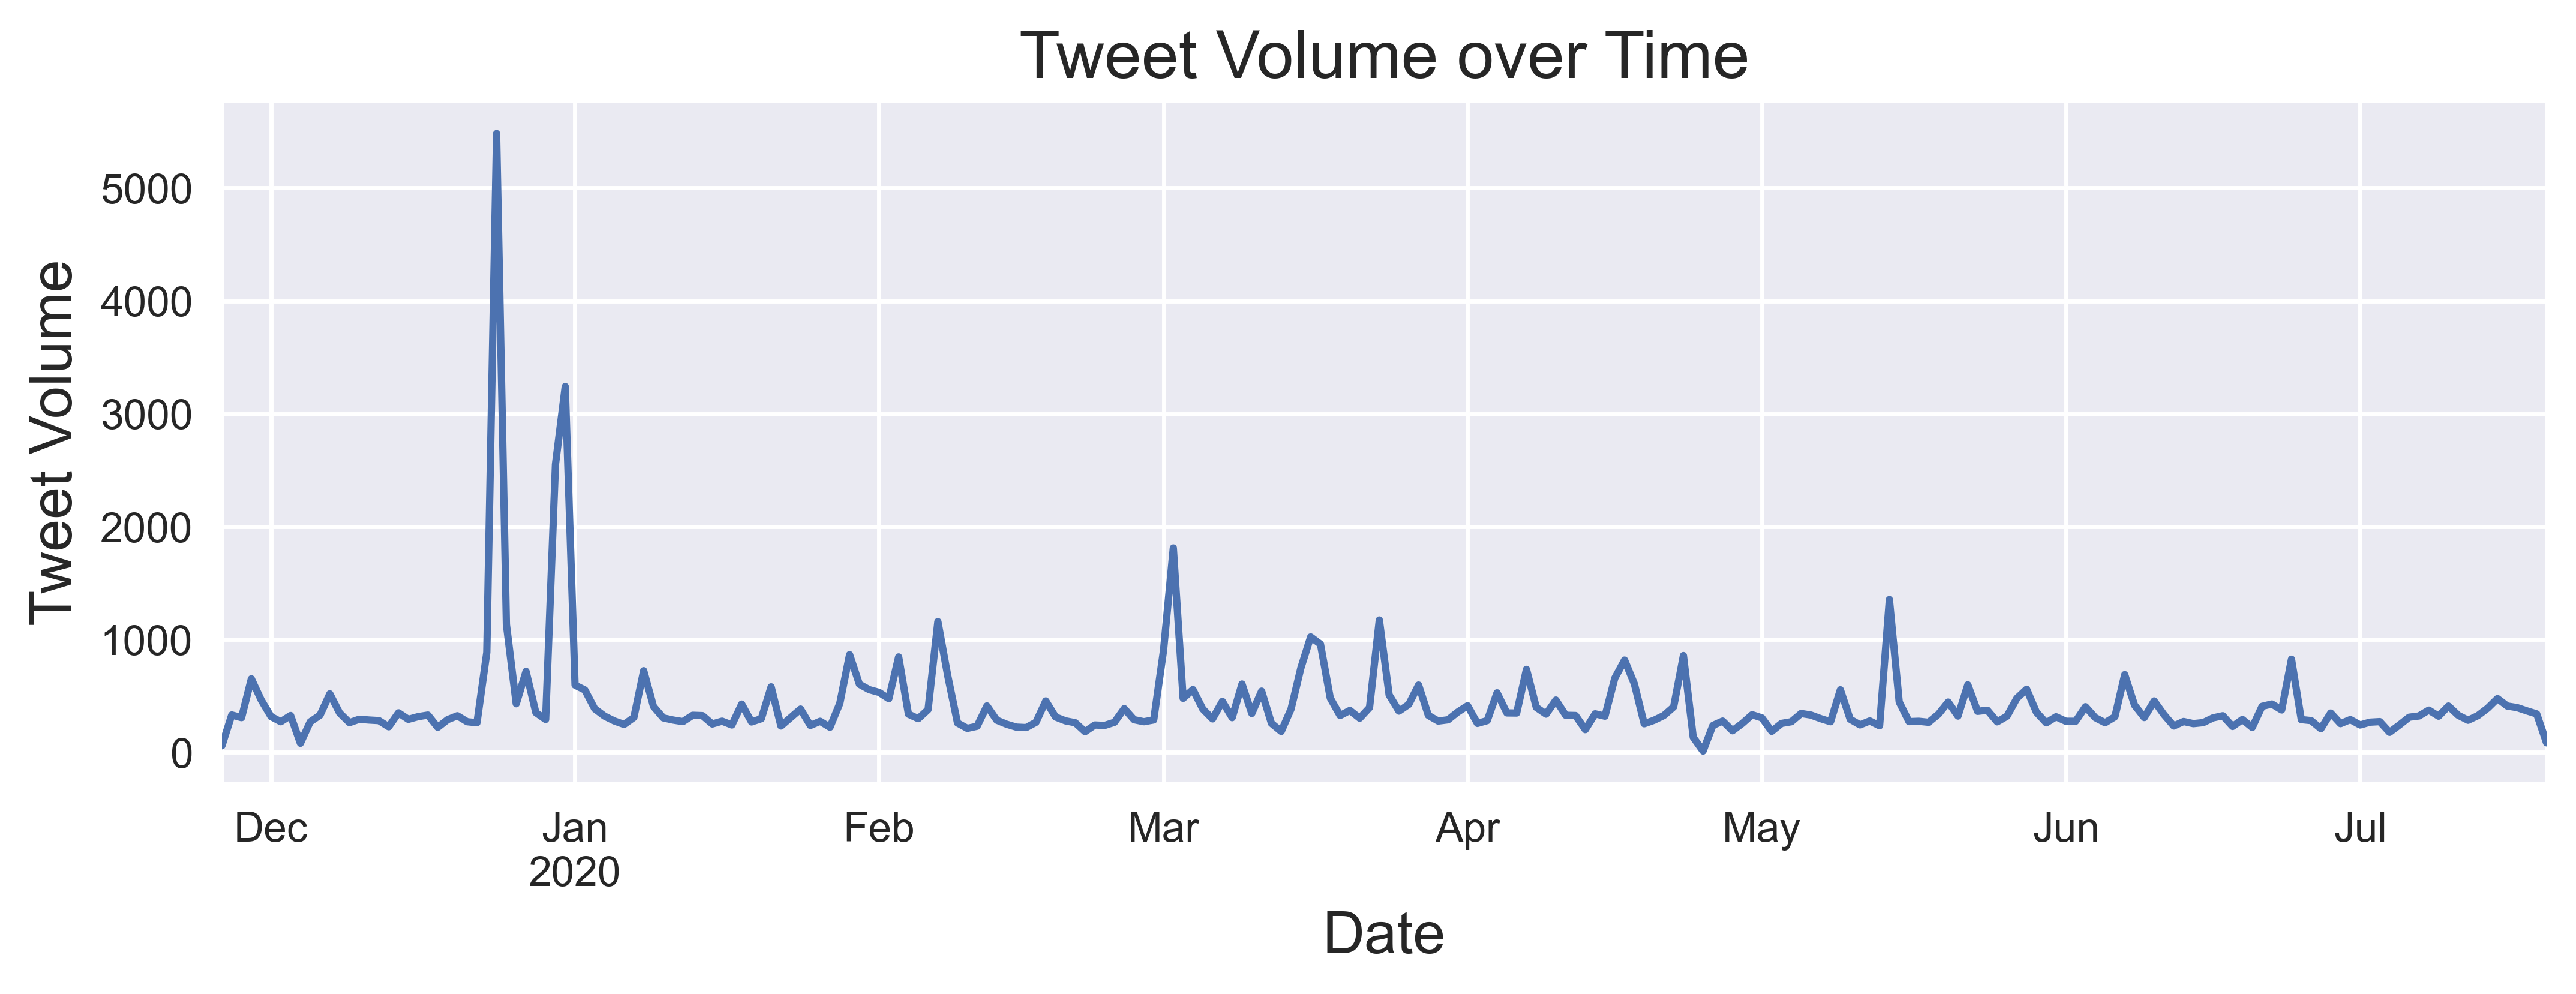
While extracting sentiment from tweets is fairly simple, there is actually a wealth of information hidden in each one. In this section, I delve into all the different types of features that can be extracted from these tweets, some of which could prove useful for modelling purposes. For the demonstration of this post, I studied one particular company as an example, referred to as Company A. I used tweepy (a Python wrapper for the Twitter API) to collect public tweets that mentioned this company from 26th November 2019 to 20th July 2020. In total, 85,490 tweets were collected, covering 242 days, and the distribution of these tweets is presented in the chart below. The tweets were grouped on a daily basis to create a set of aggregate features for every day, as outlined in this section.
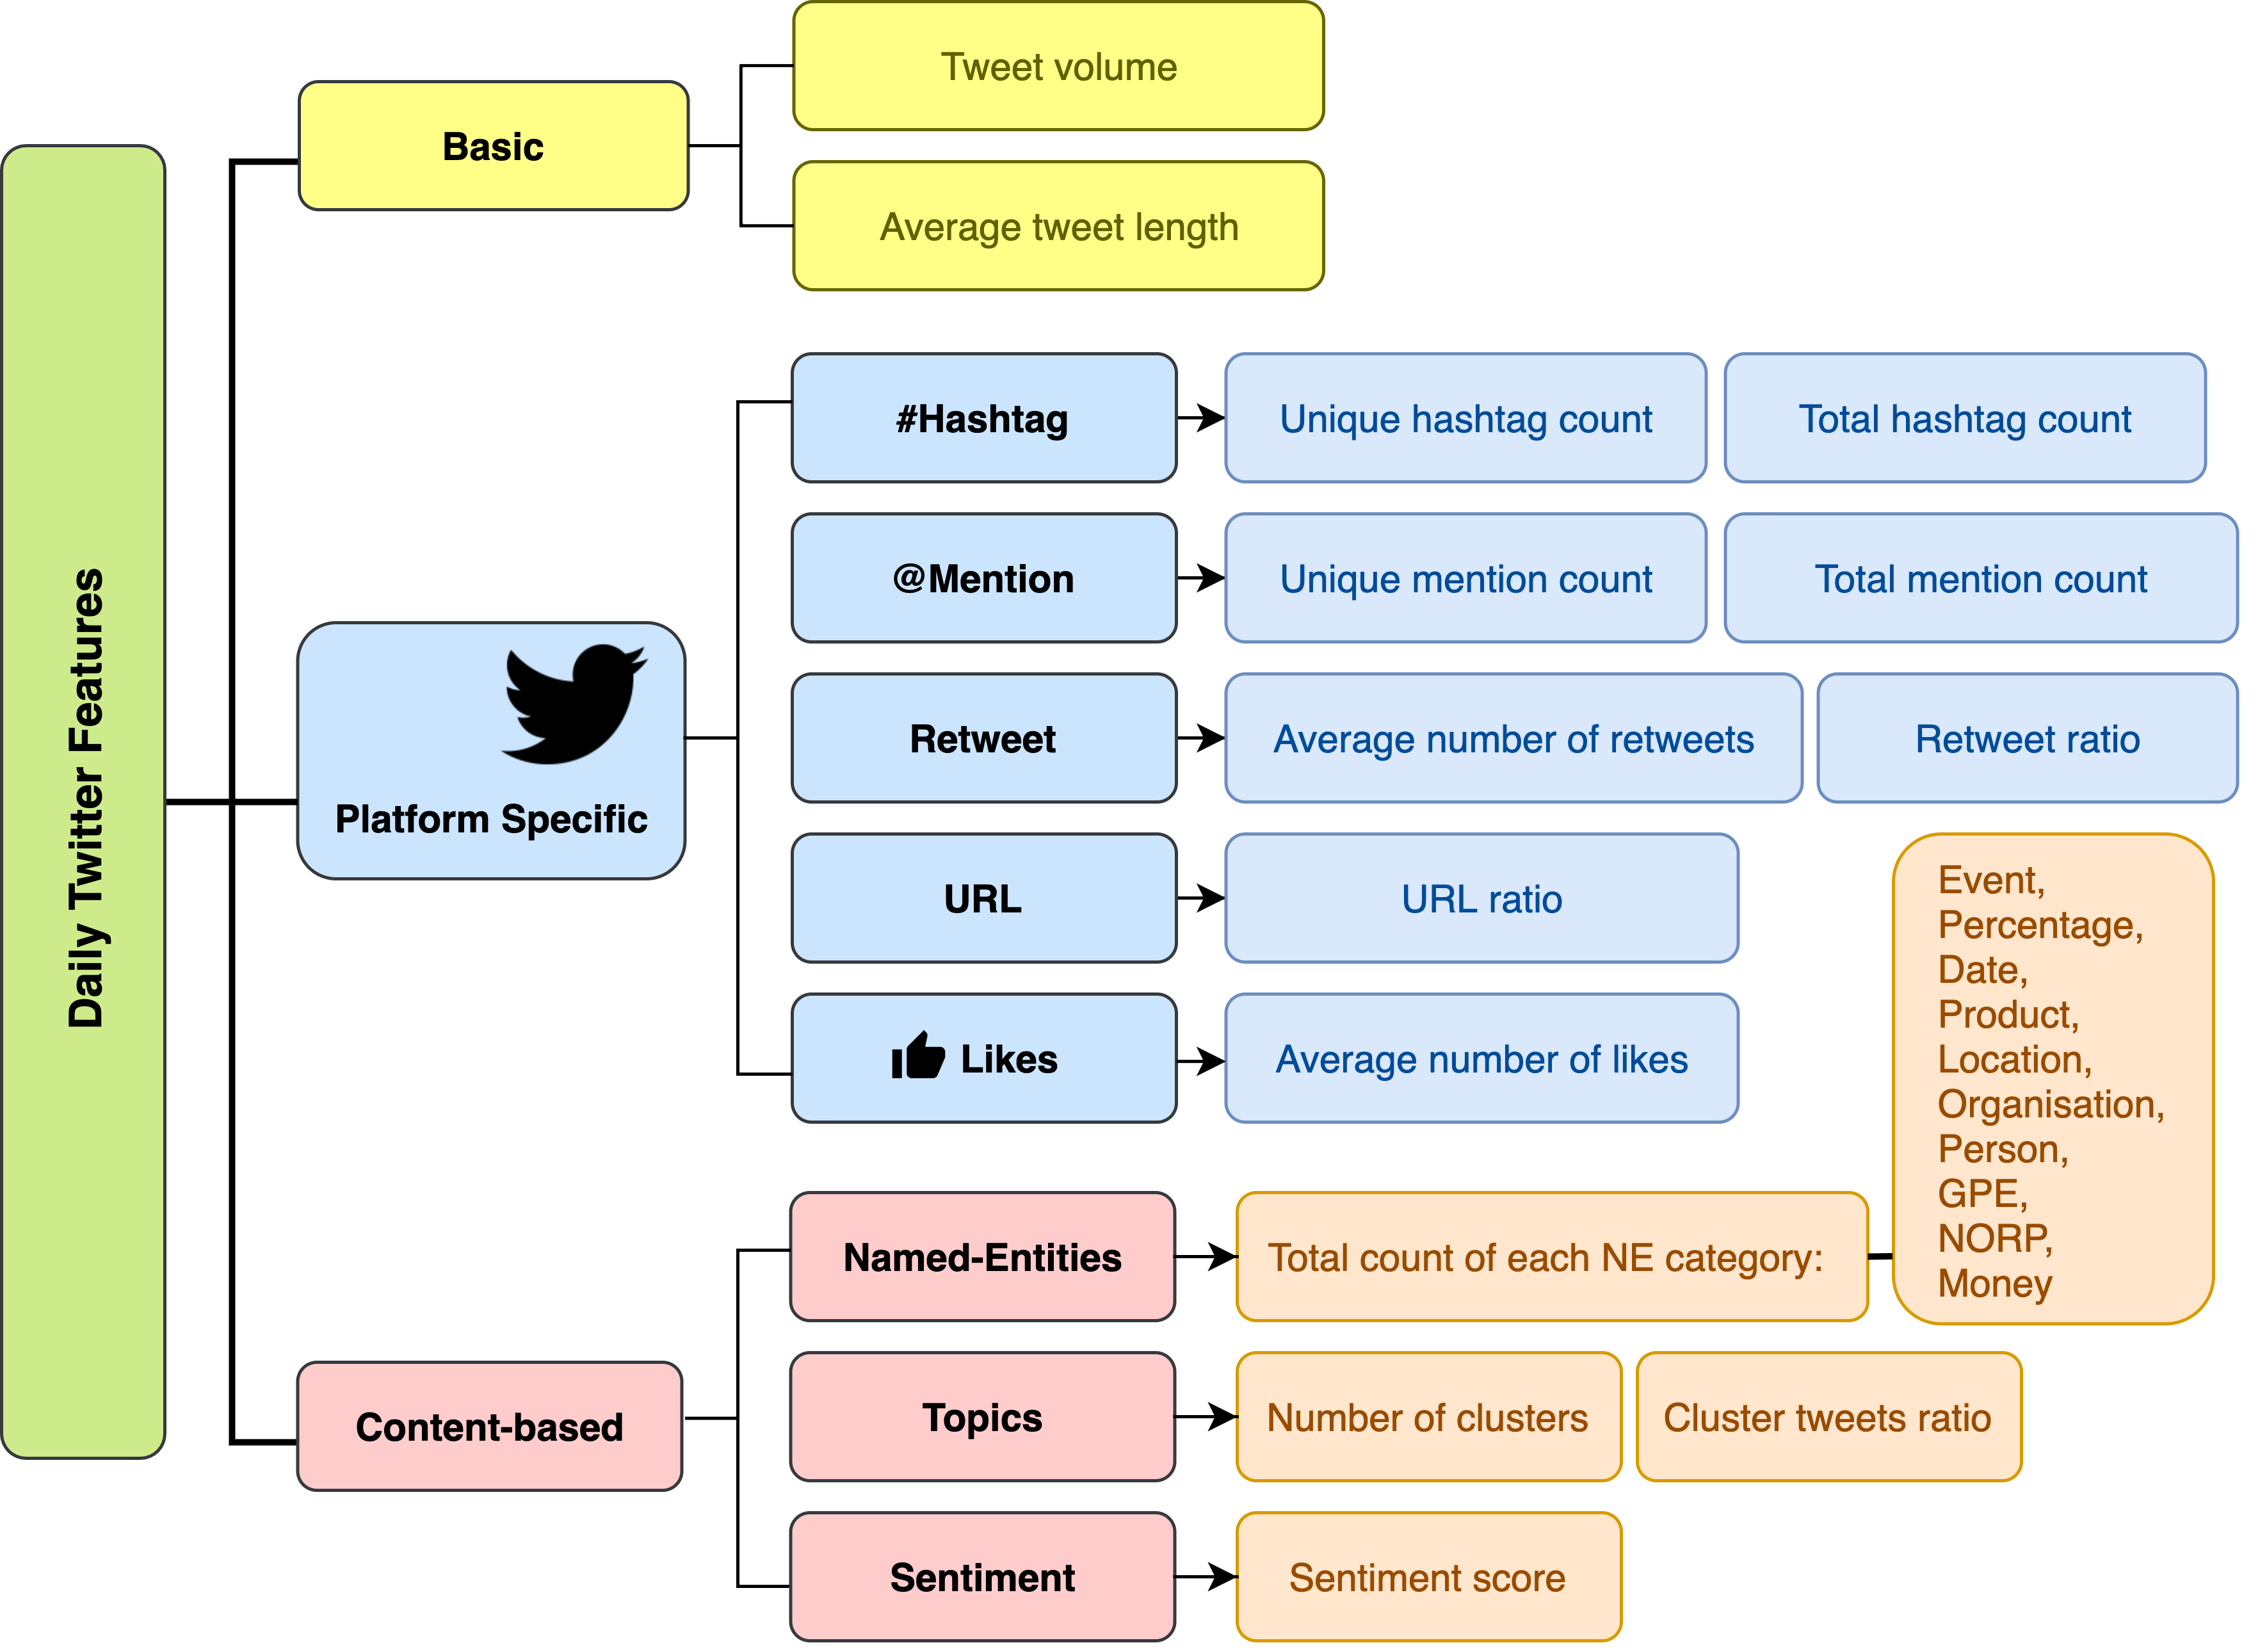
Before describing these features, it is important to stress that all of the features are snapshots taken at the end of each day. For every tweet, the number of likes and retweets might continue to increase every day. If snapshots are not taken, the data will contain information from the future. This common pitfall in machine learning is known as data leakage and as our data comes as a time series, it is absolutely crucial that we do not make this mistake for future prediction. Let's now explore the features which can be generated for modelling purposes, as outlined in the diagram below.
1. Basic Features
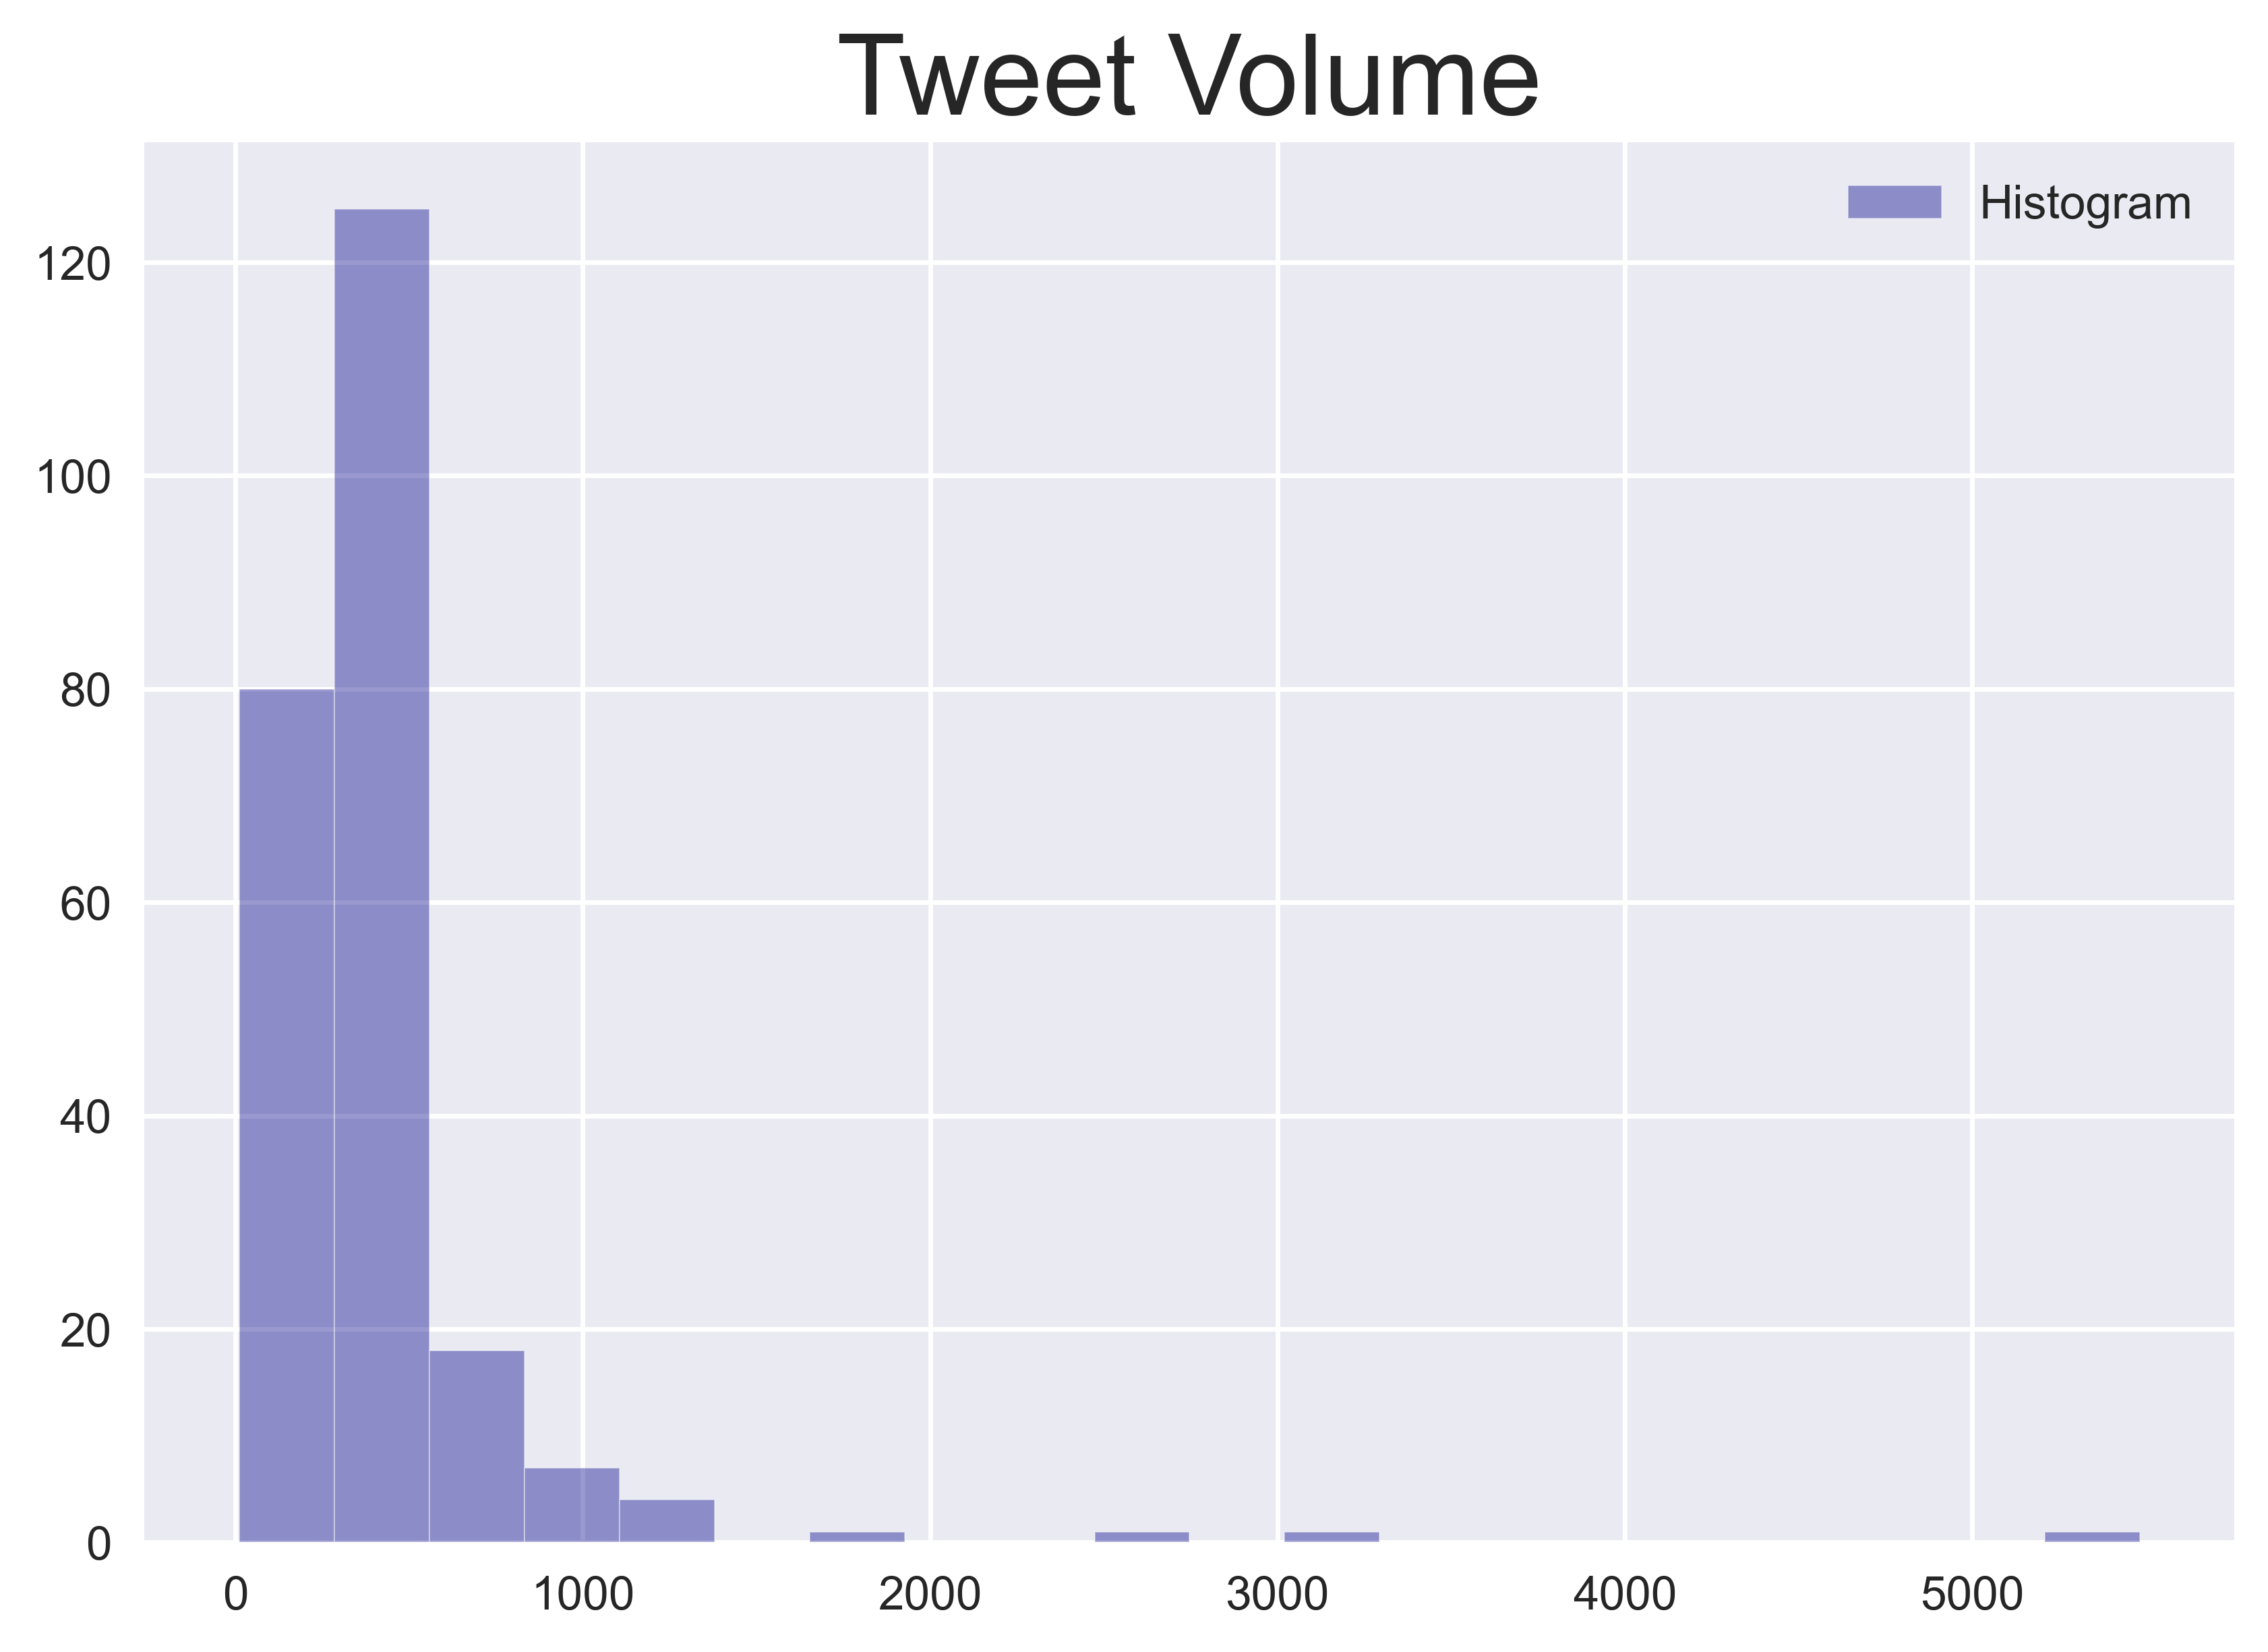
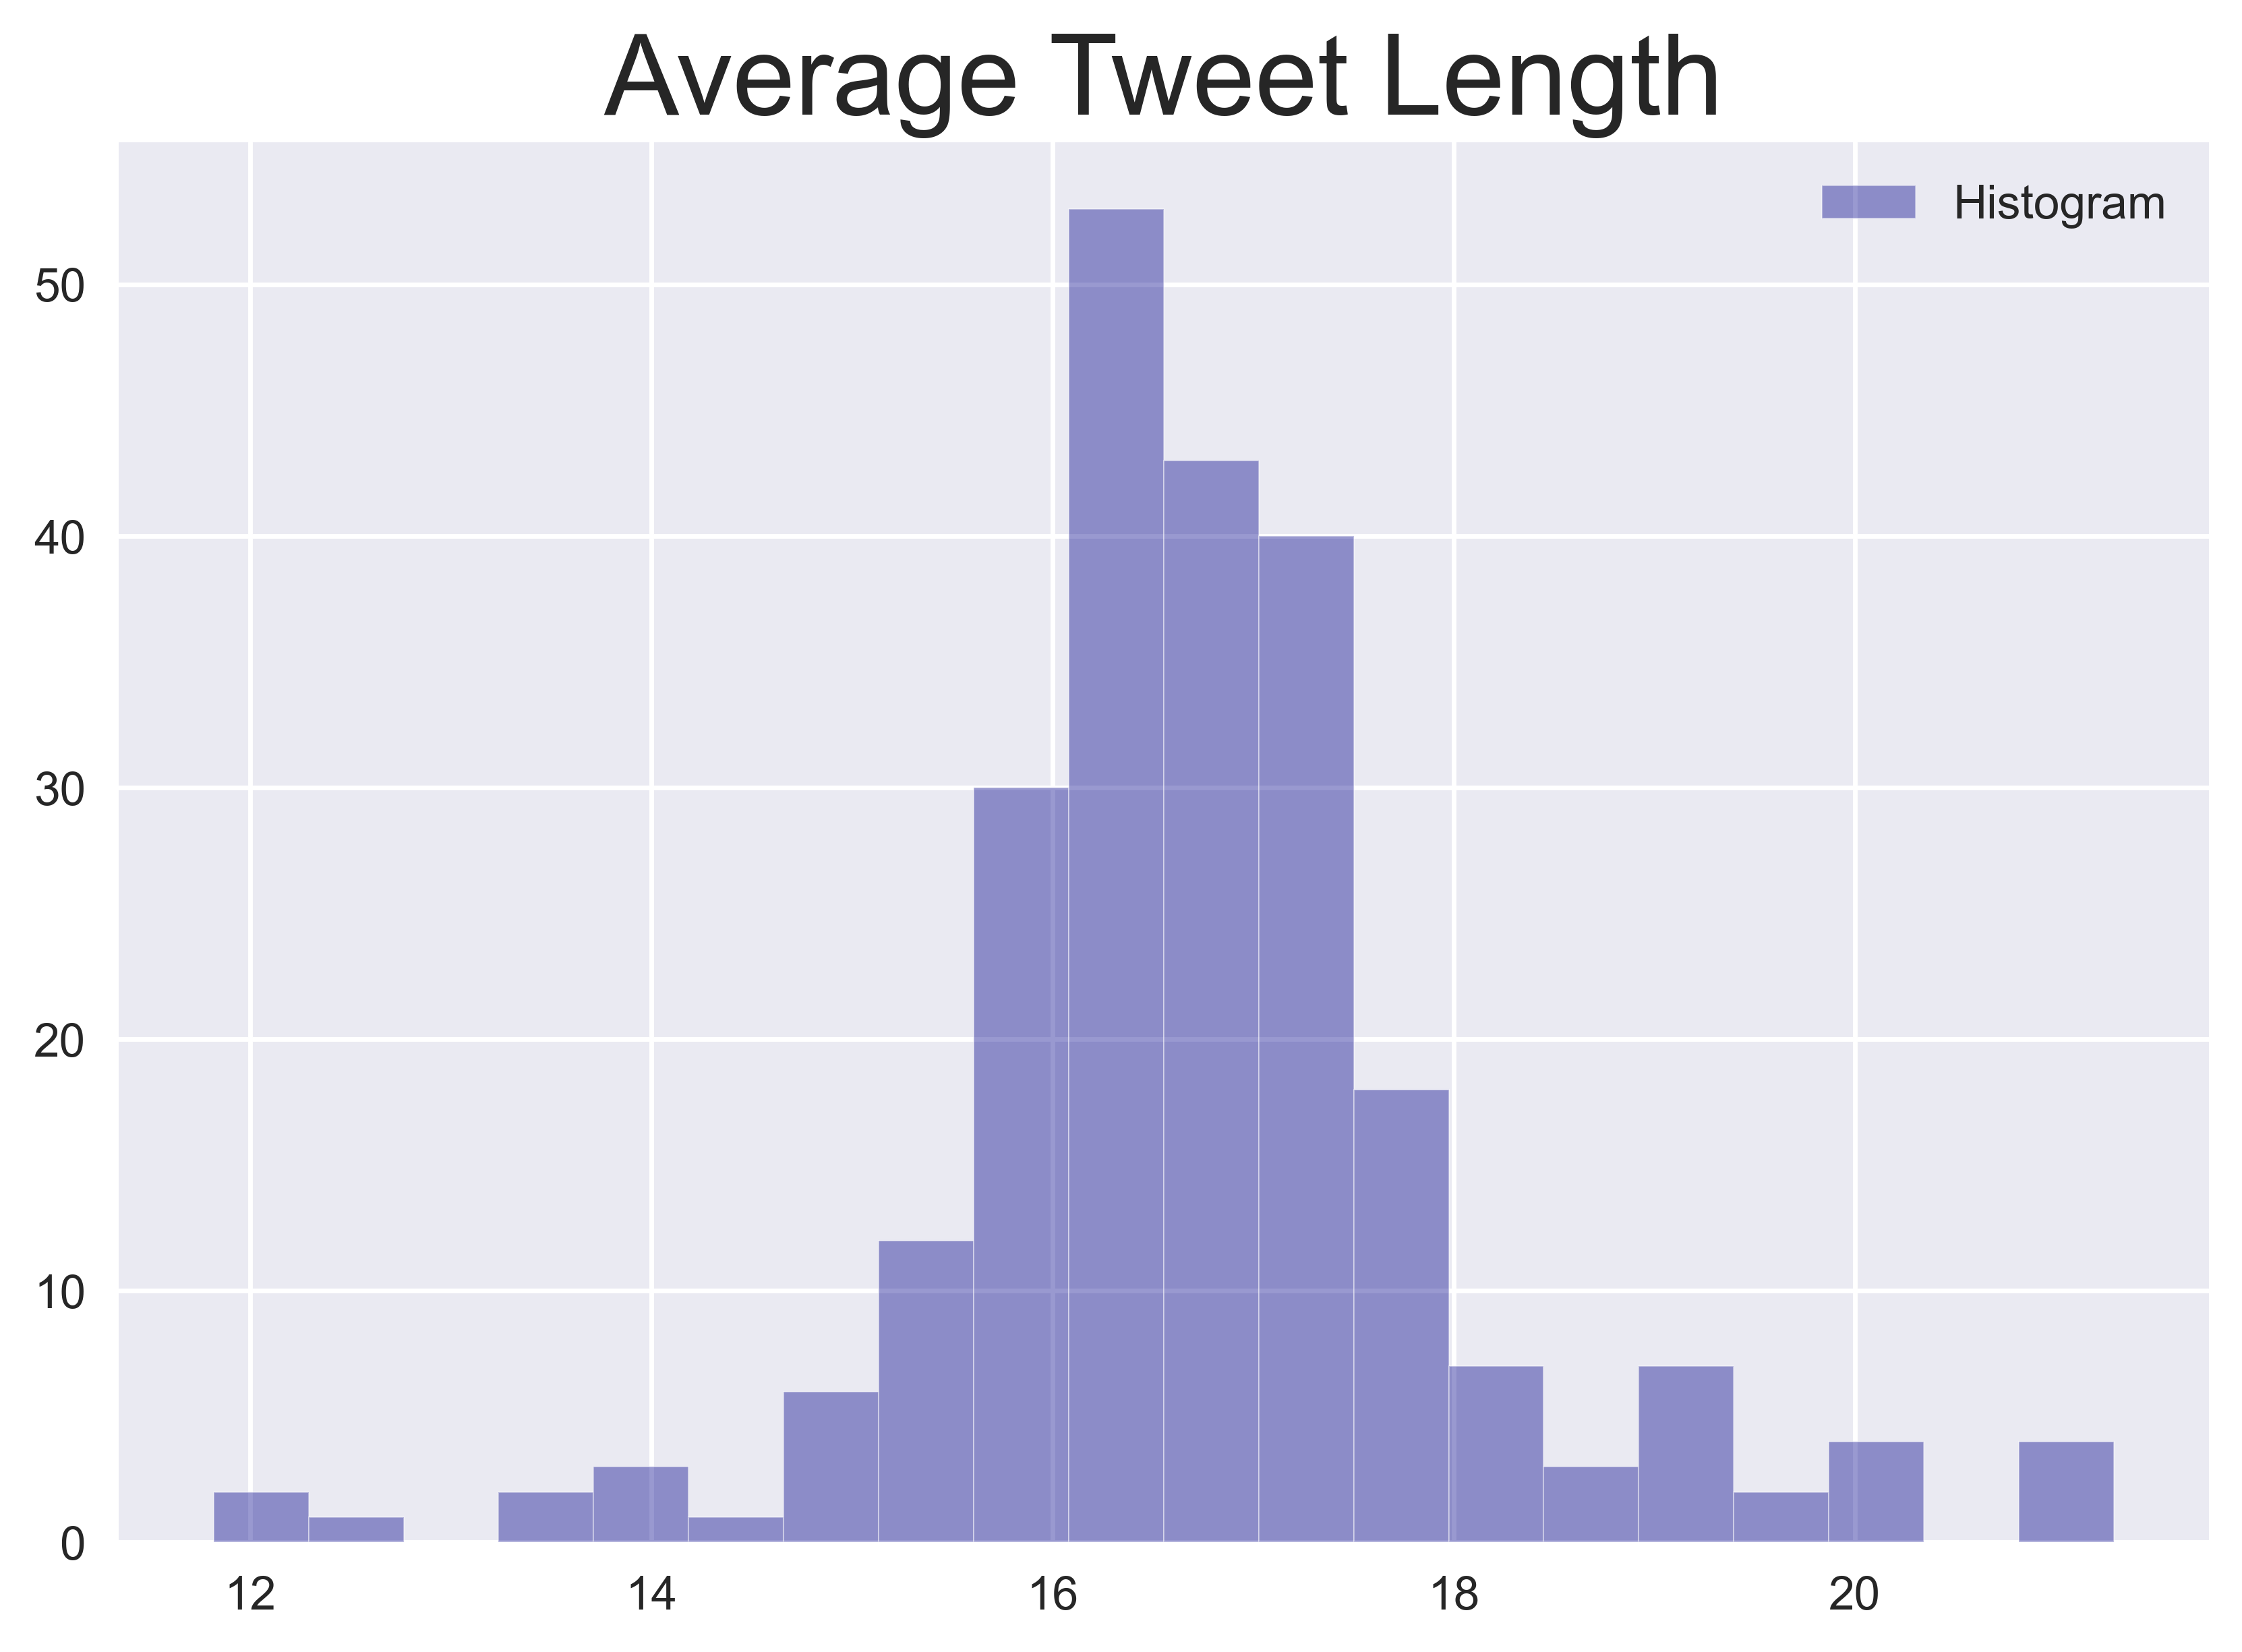
To start, some simple statistics can be extracted fairly easily such as the volume of tweets and the average length of tweets each day. You can always get your creative juices flowing and define more measures in this category. The distributions of each feature for the entire dataset are shown in the subsequent plots below.
2. Twitter Platform Features
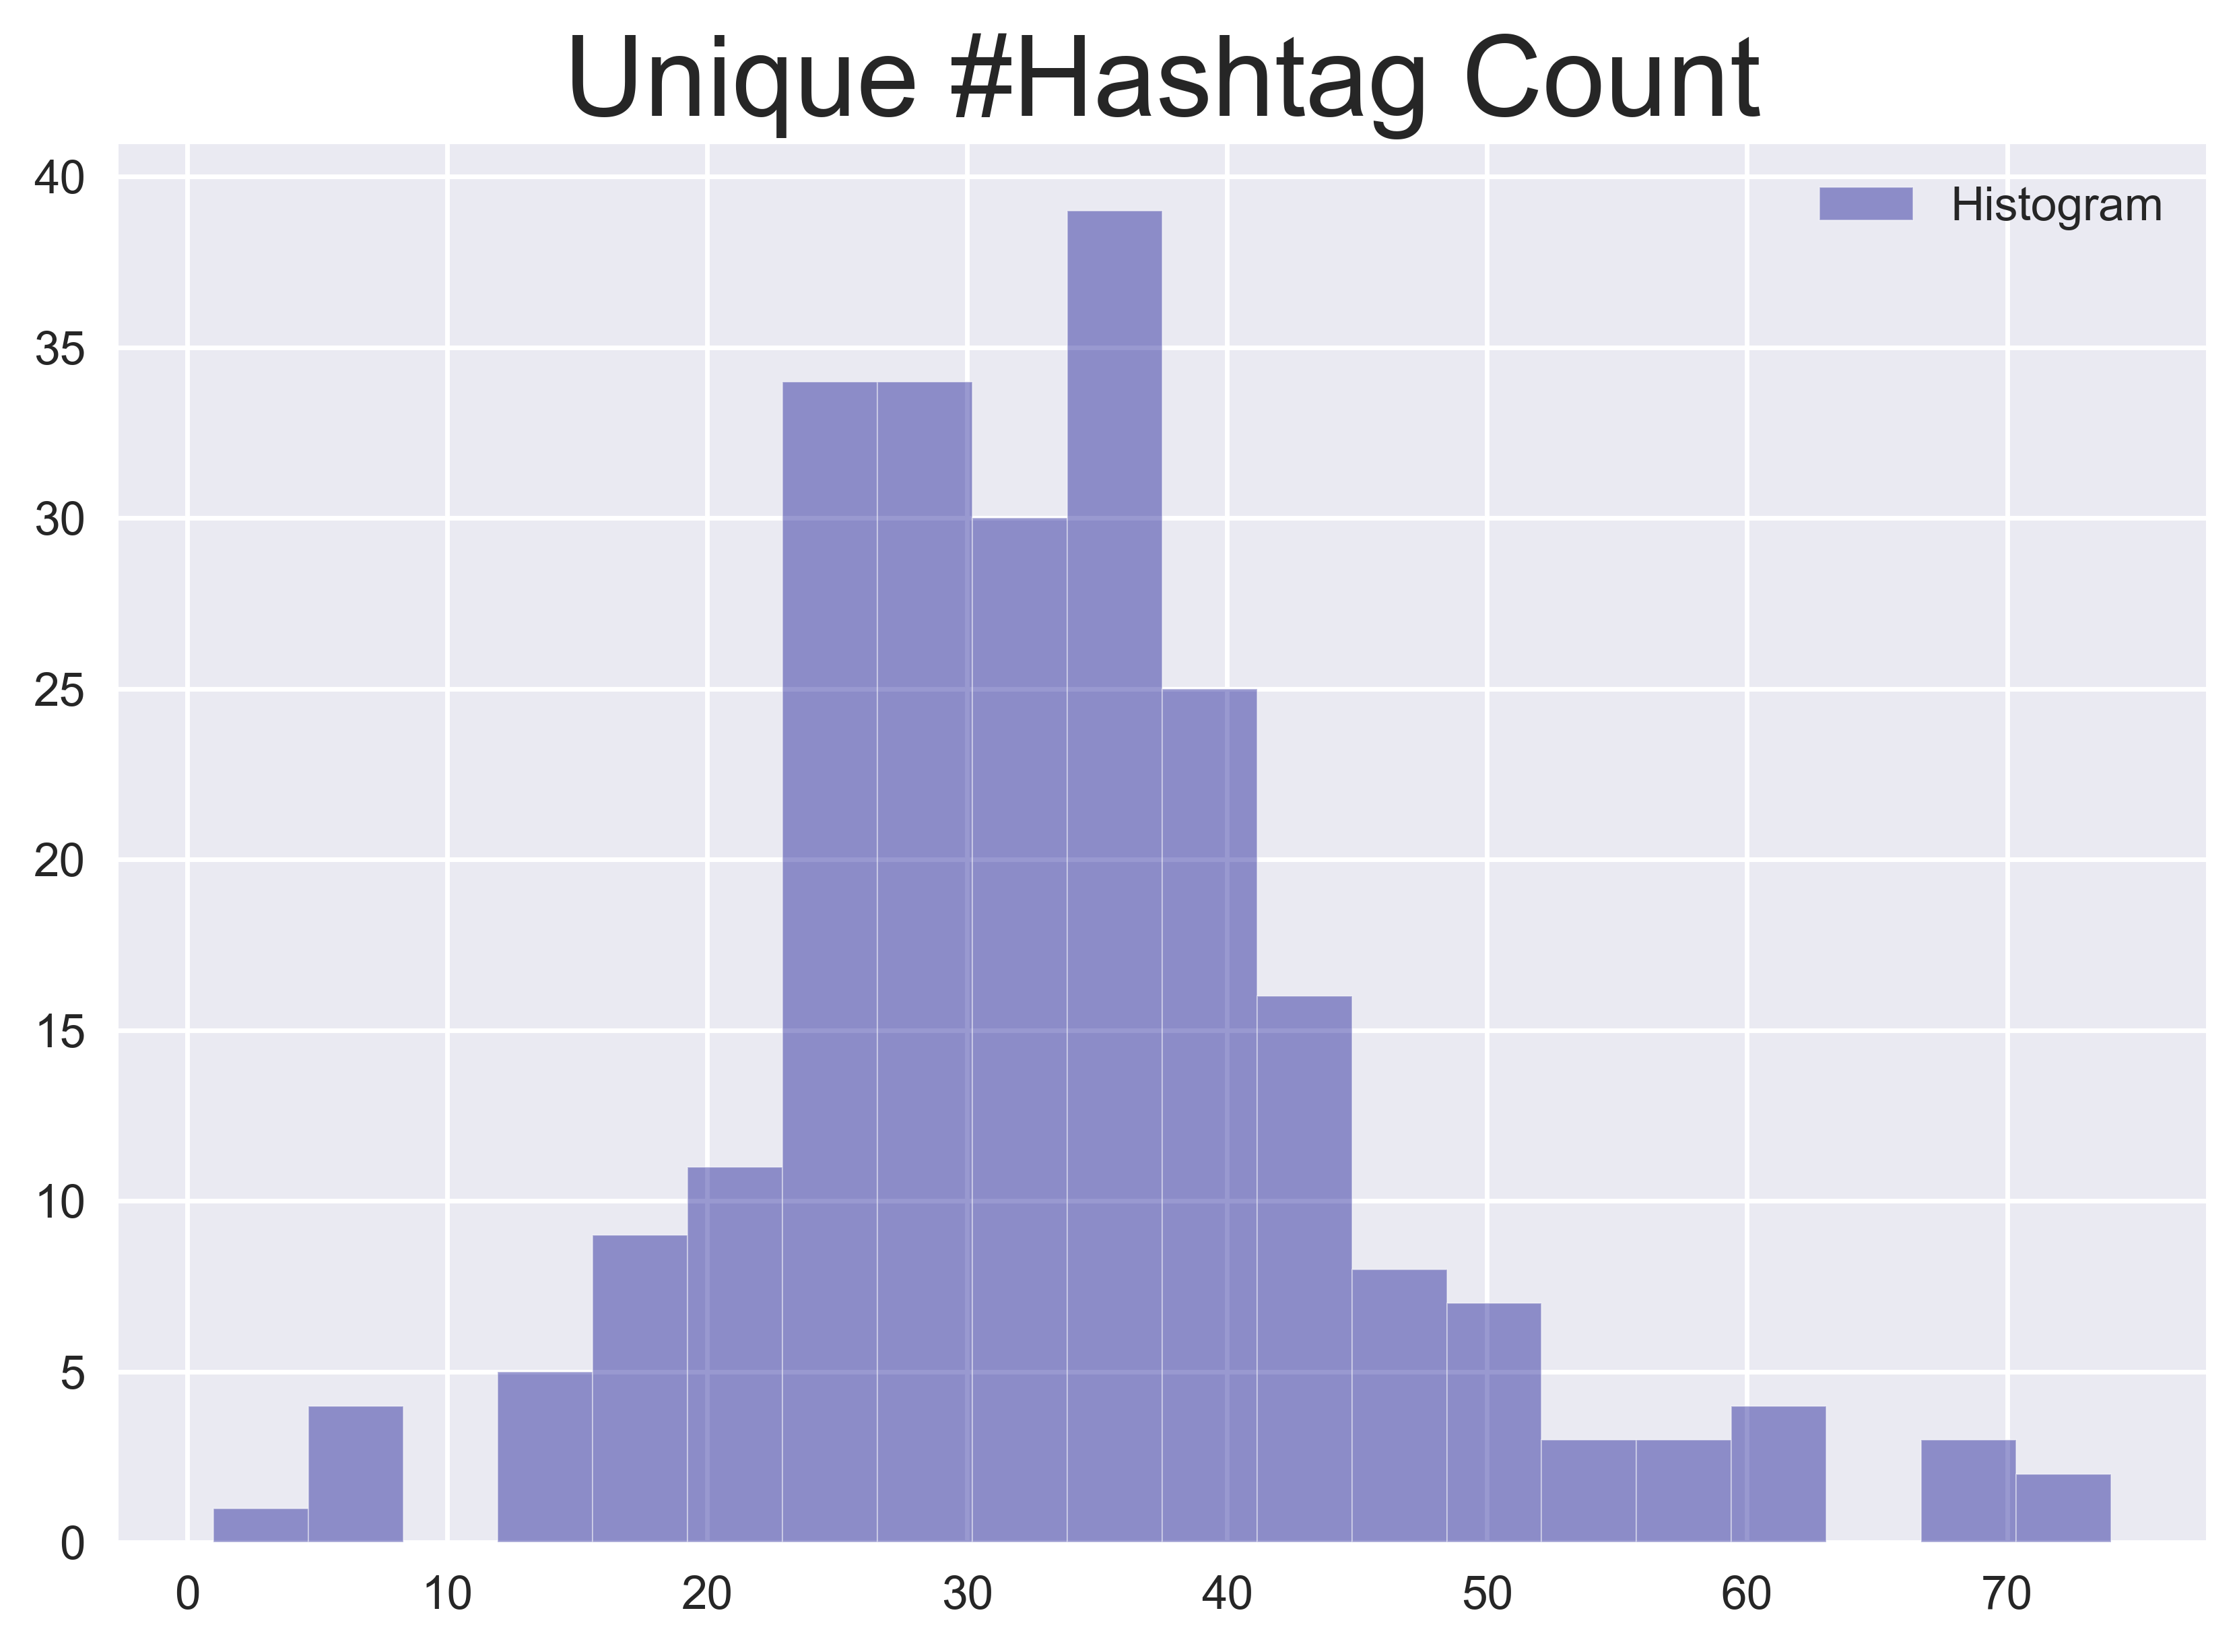
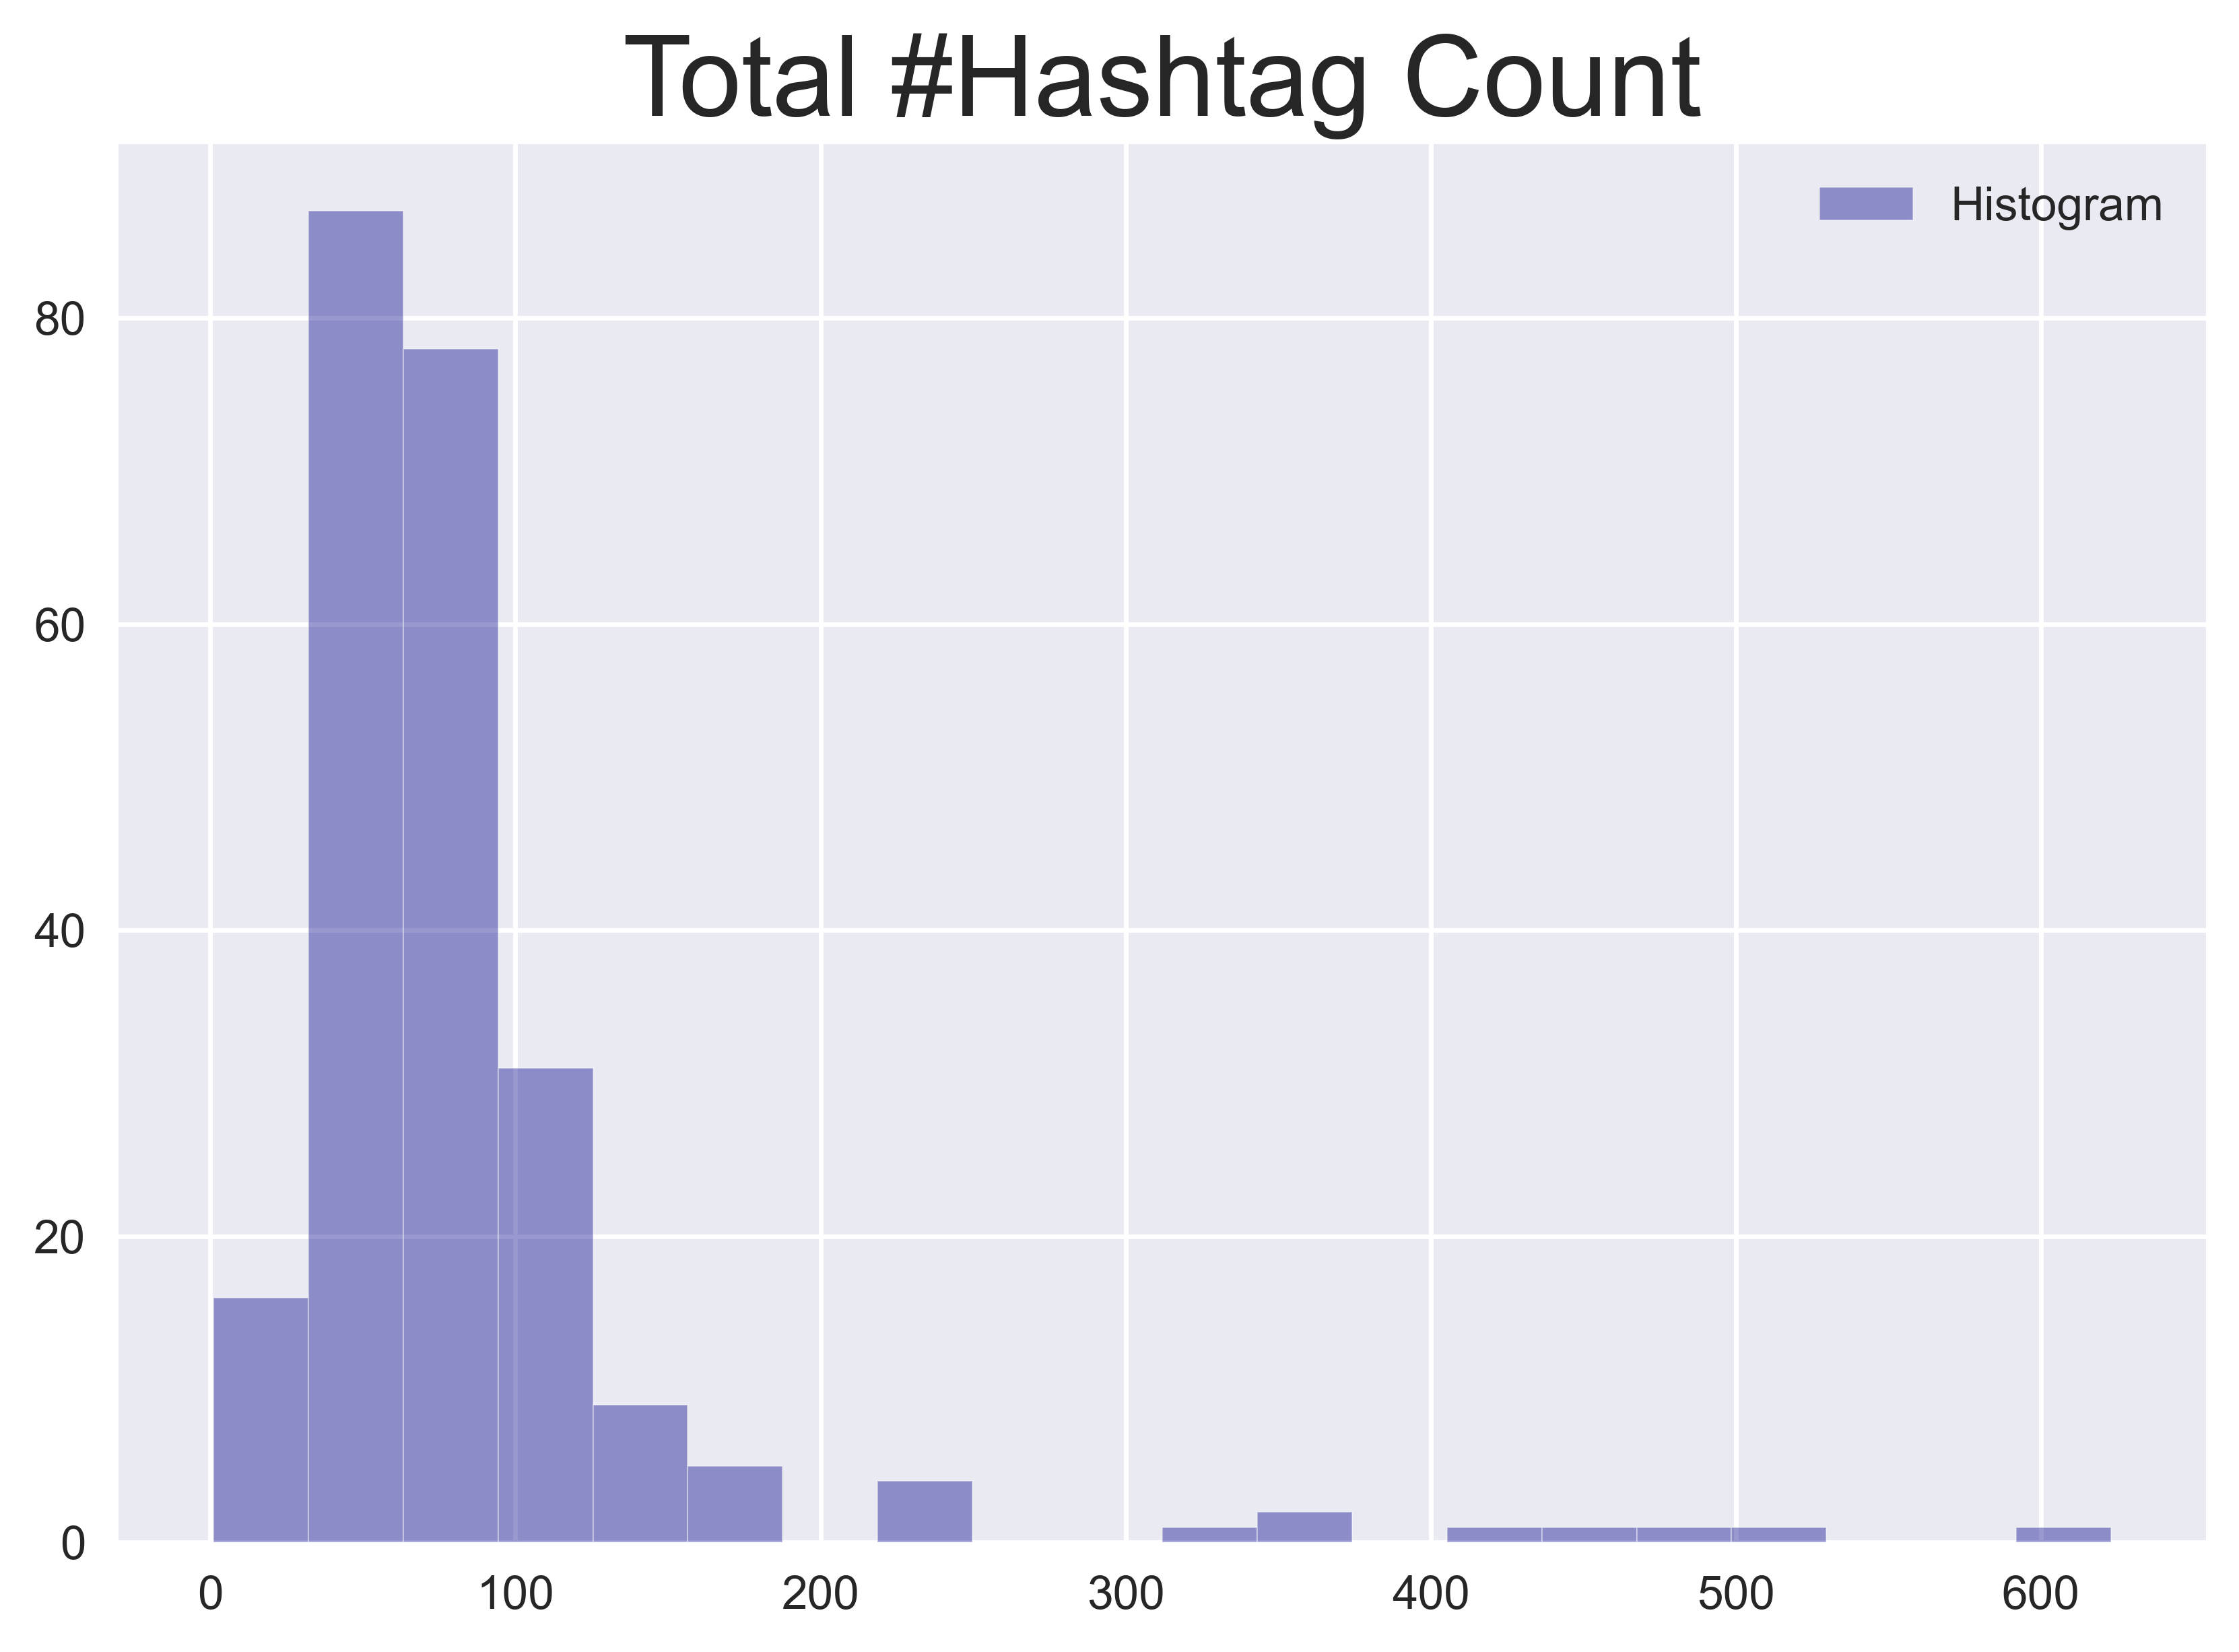
Twitter offers a number of functions for online users to share content and express themselves. These platform-specific functions can be used as features. For instance, from the use of hashtags, two measures can be created by counting 1), the number of unique hashtags used and 2), the total number of hashtags used. Since hashtags are used for tagging the subject or topic of a tweet, these features describe how many specific subjects are discussed in a day and the volume of those subjects.
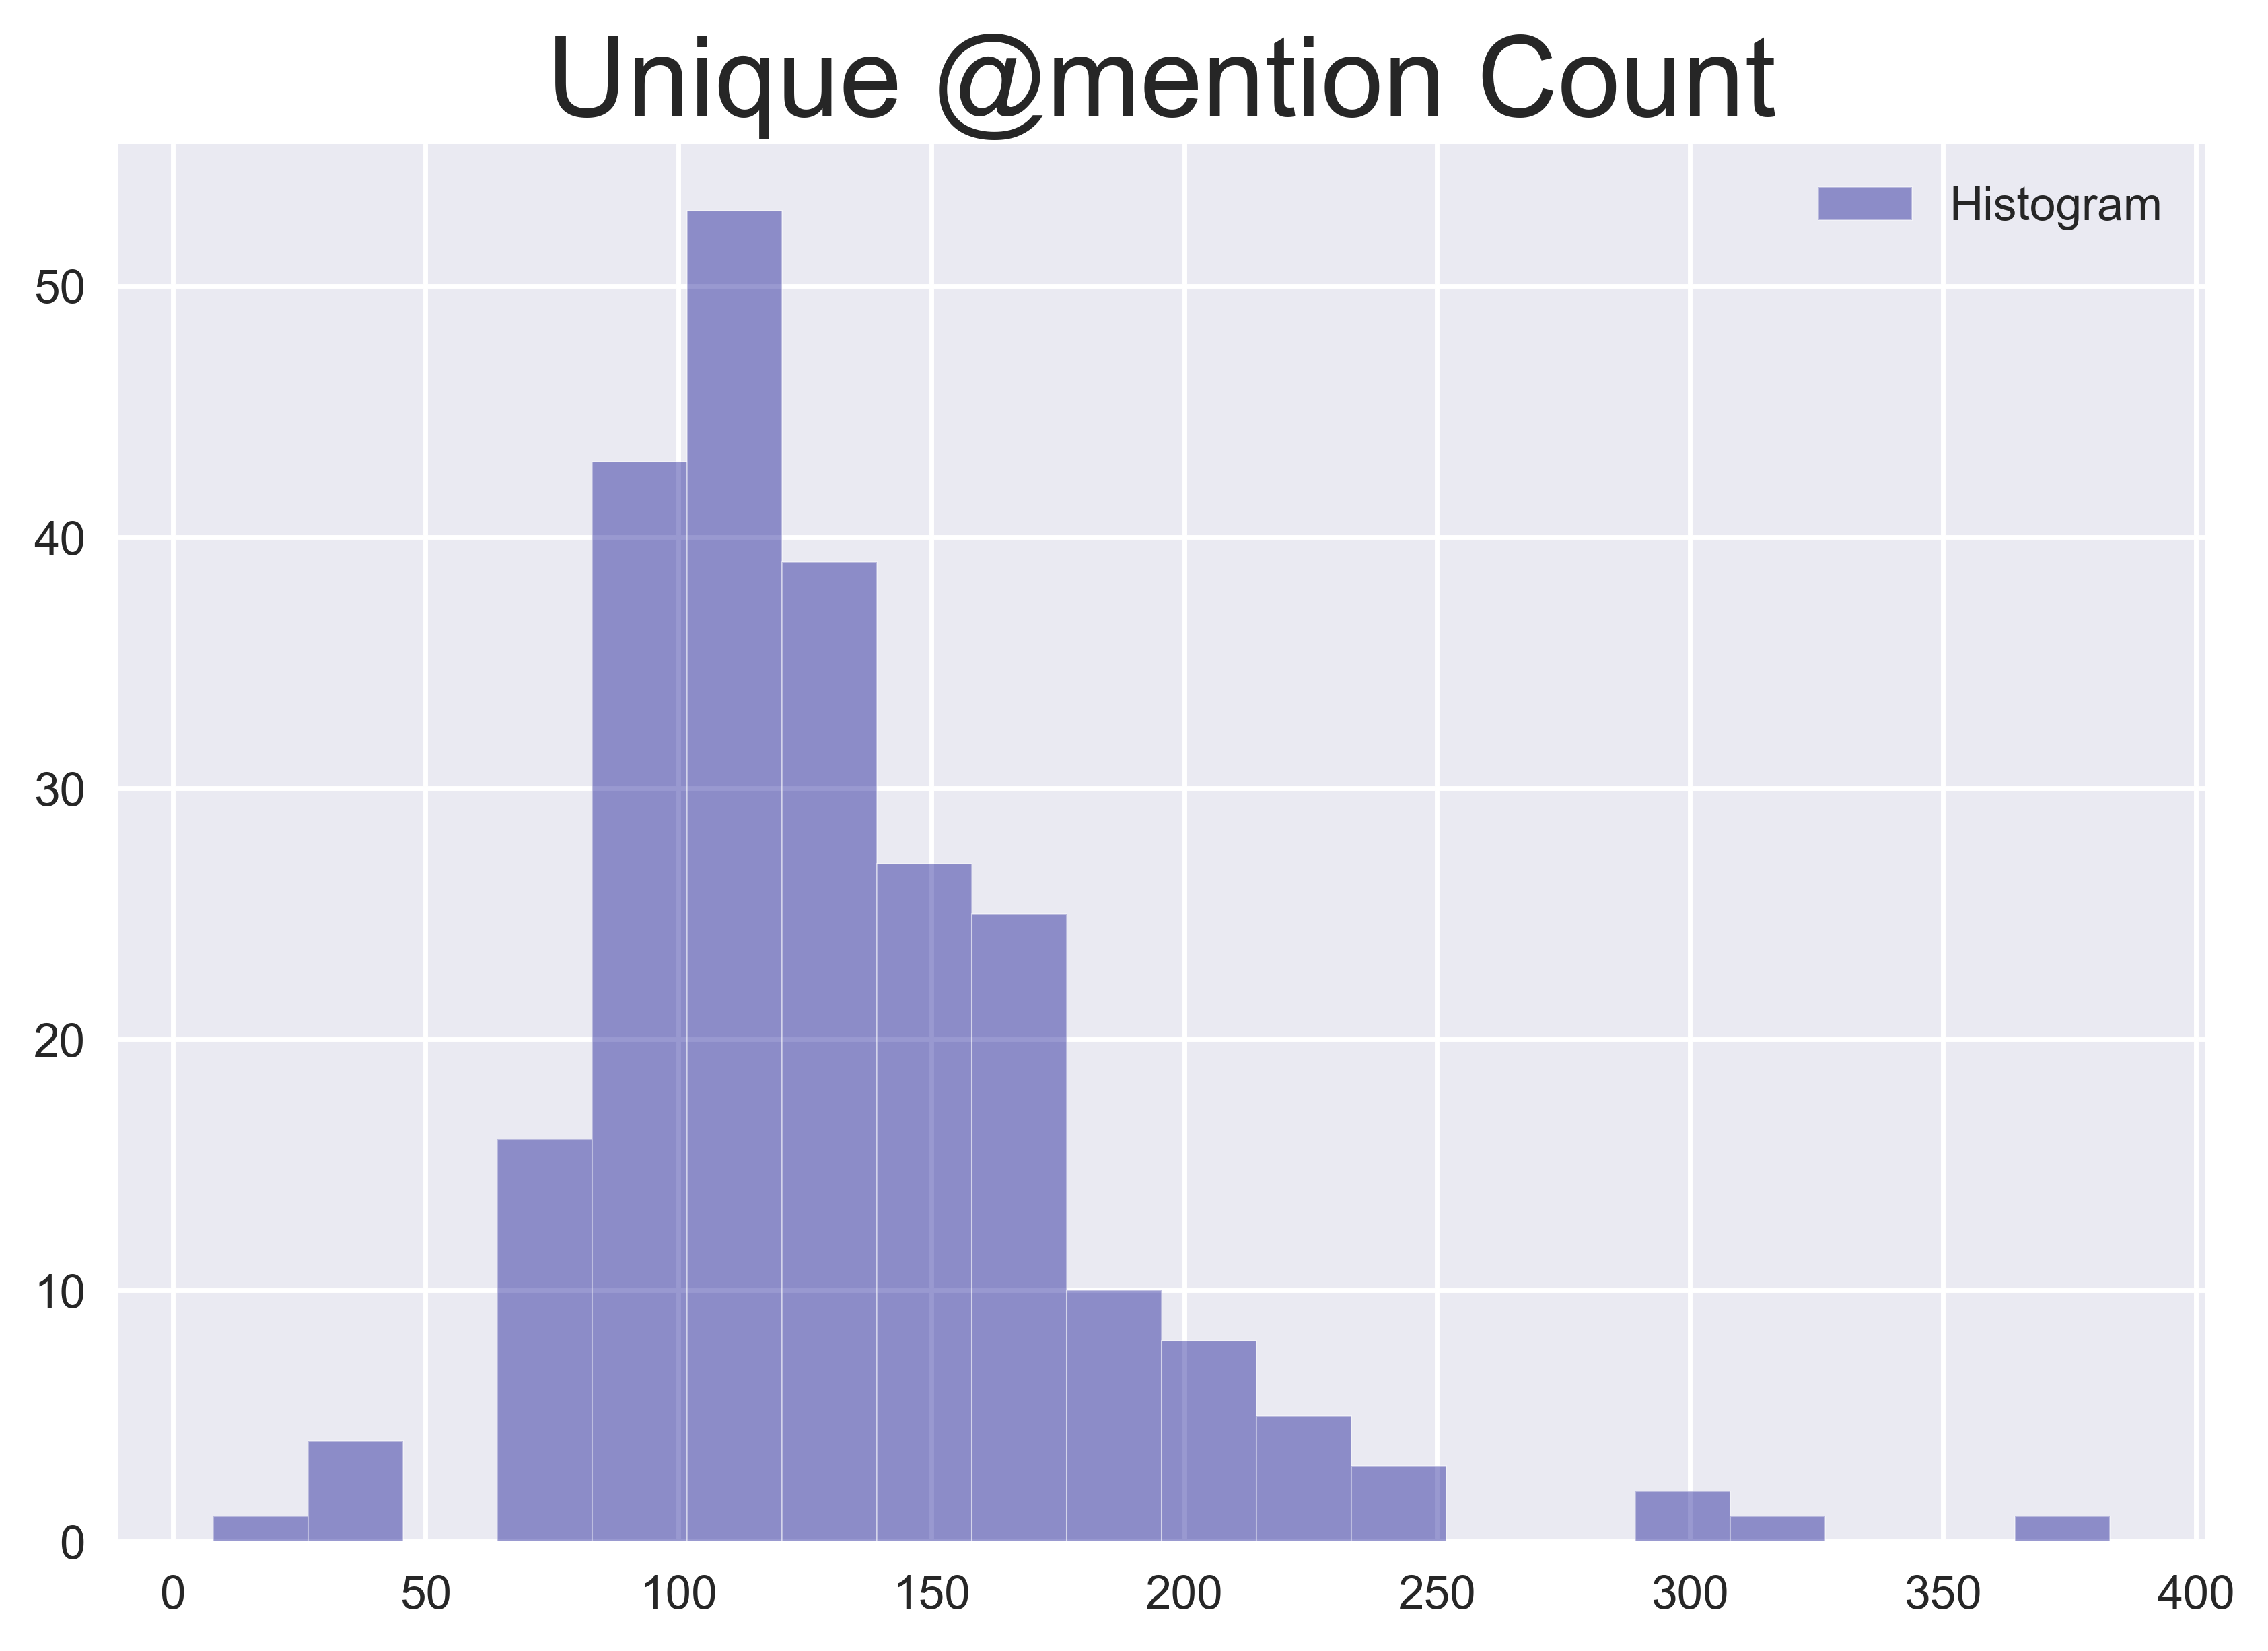
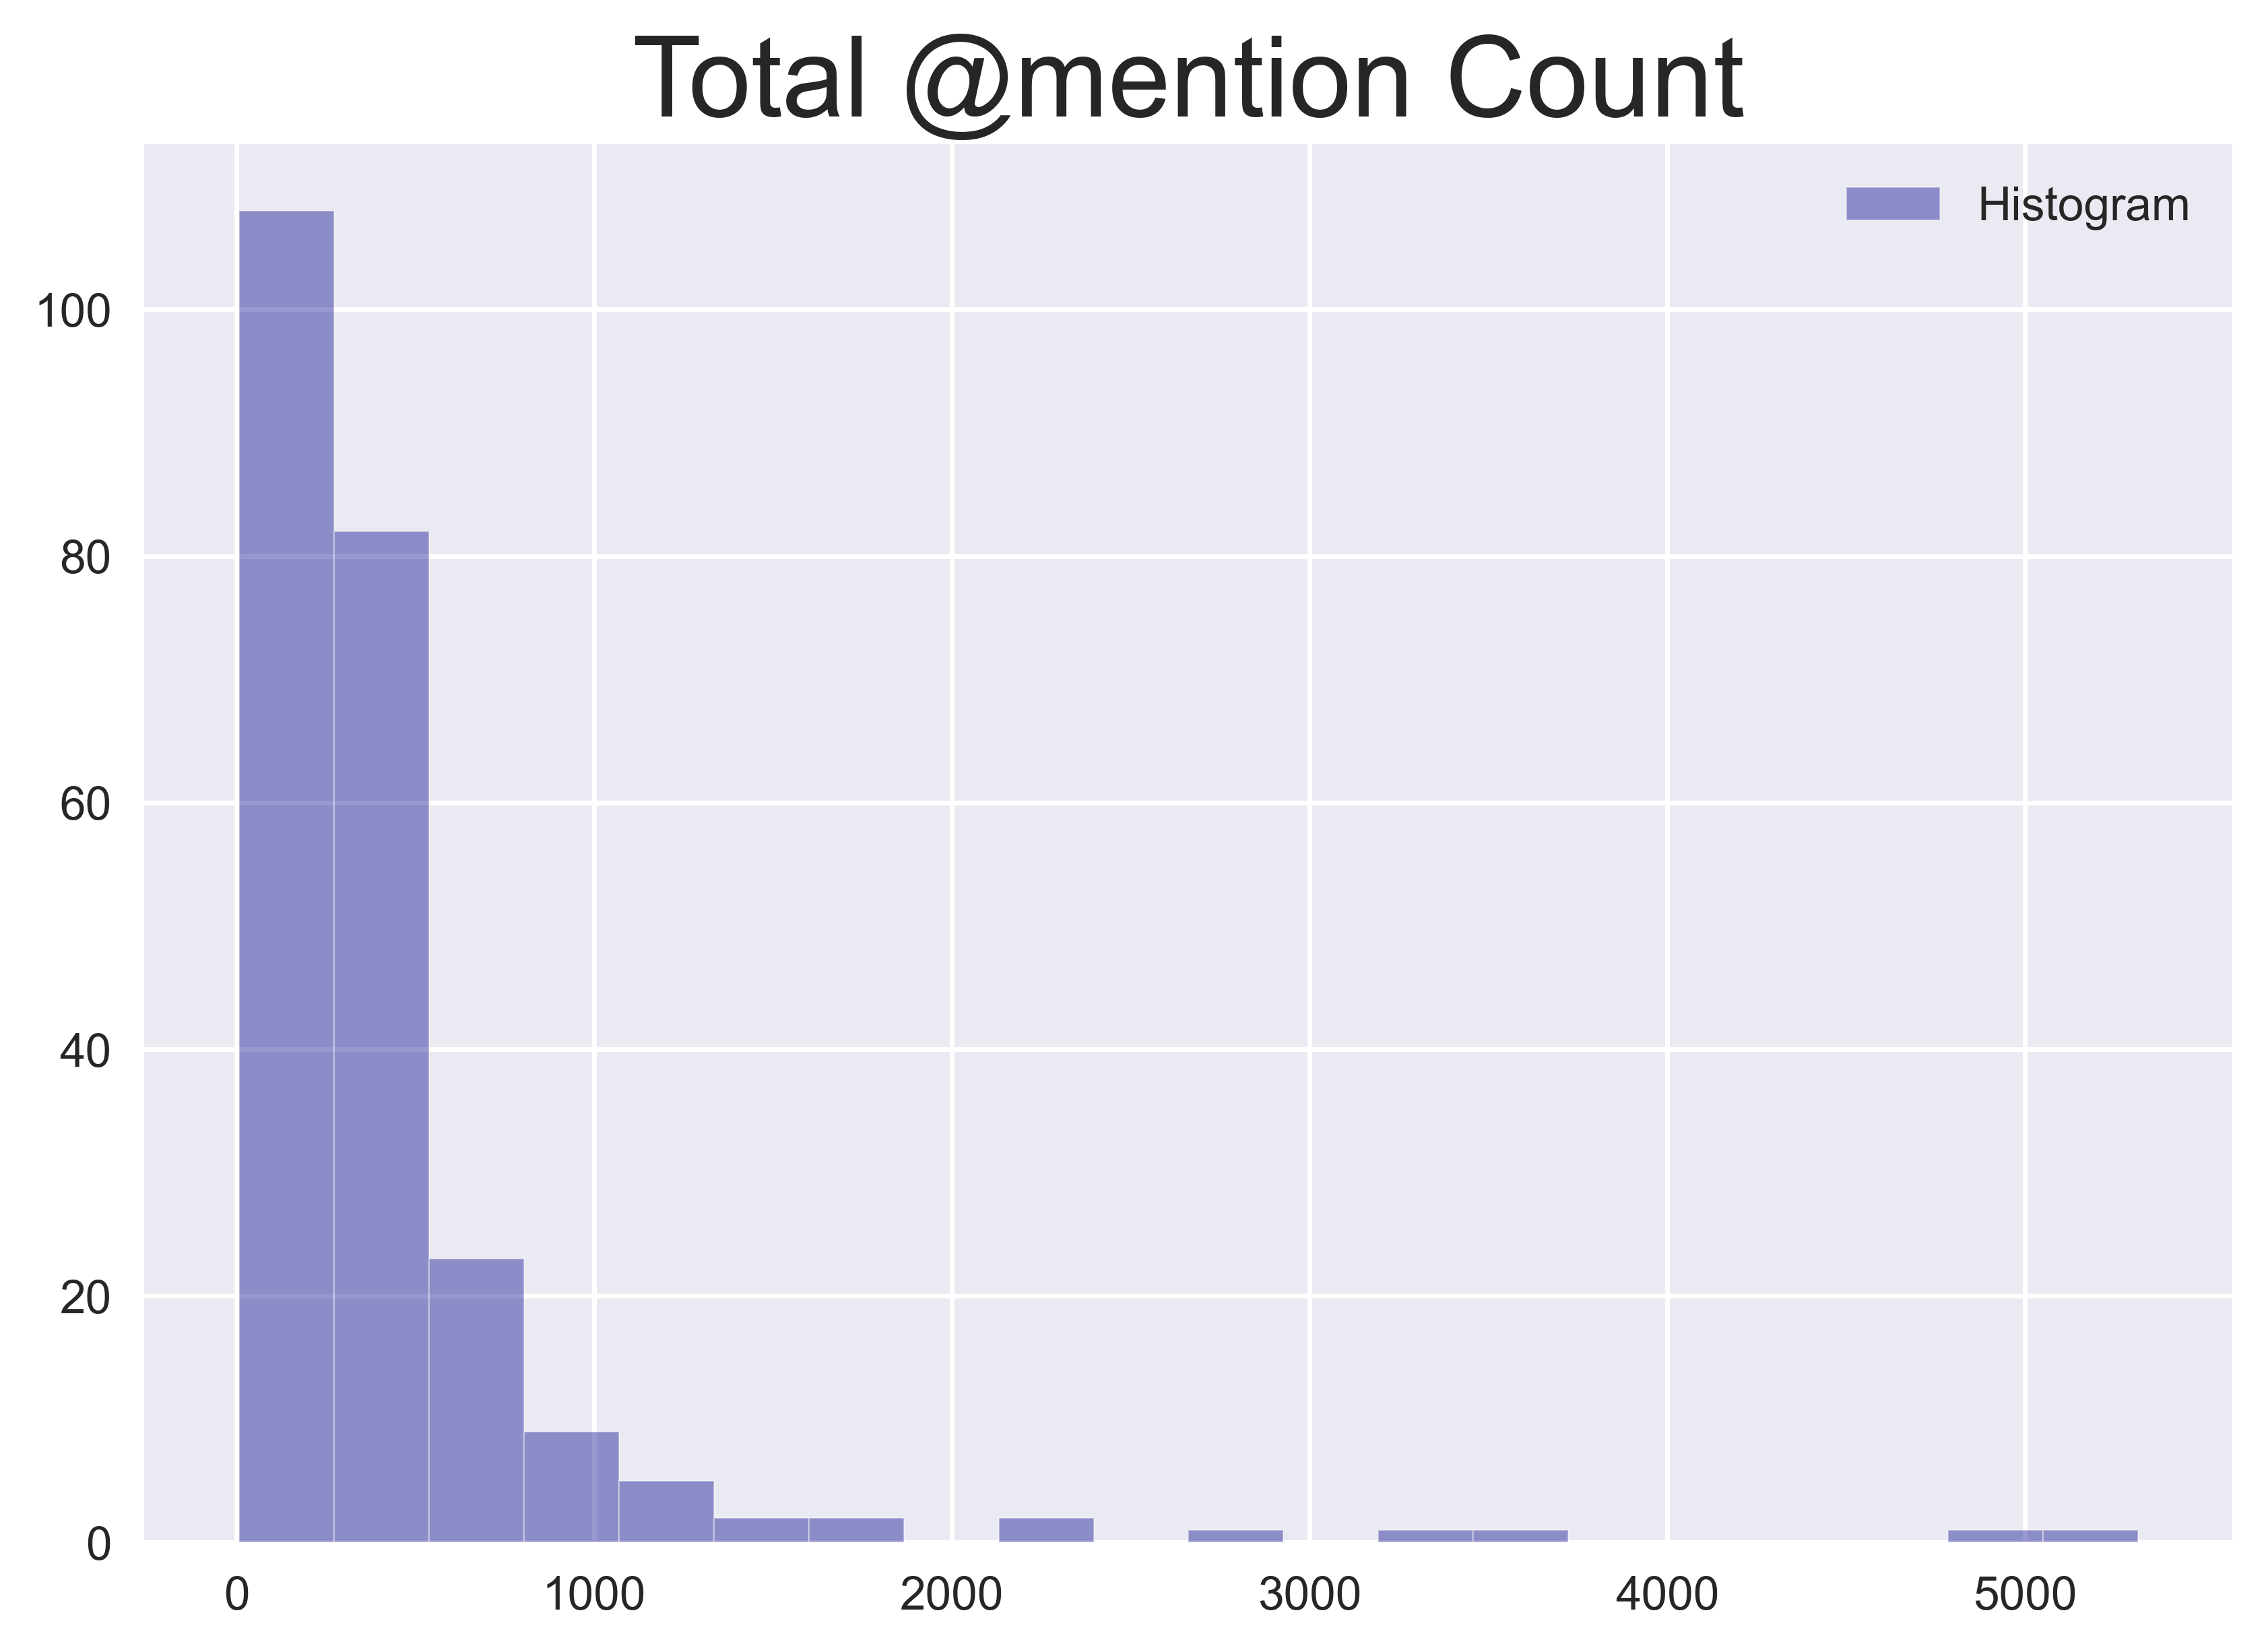
The same procedure can be followed for user mentions to obtain the number of unique mentions, and the total number of mentions which describe the volume of user interactions through tweets, on a given day.
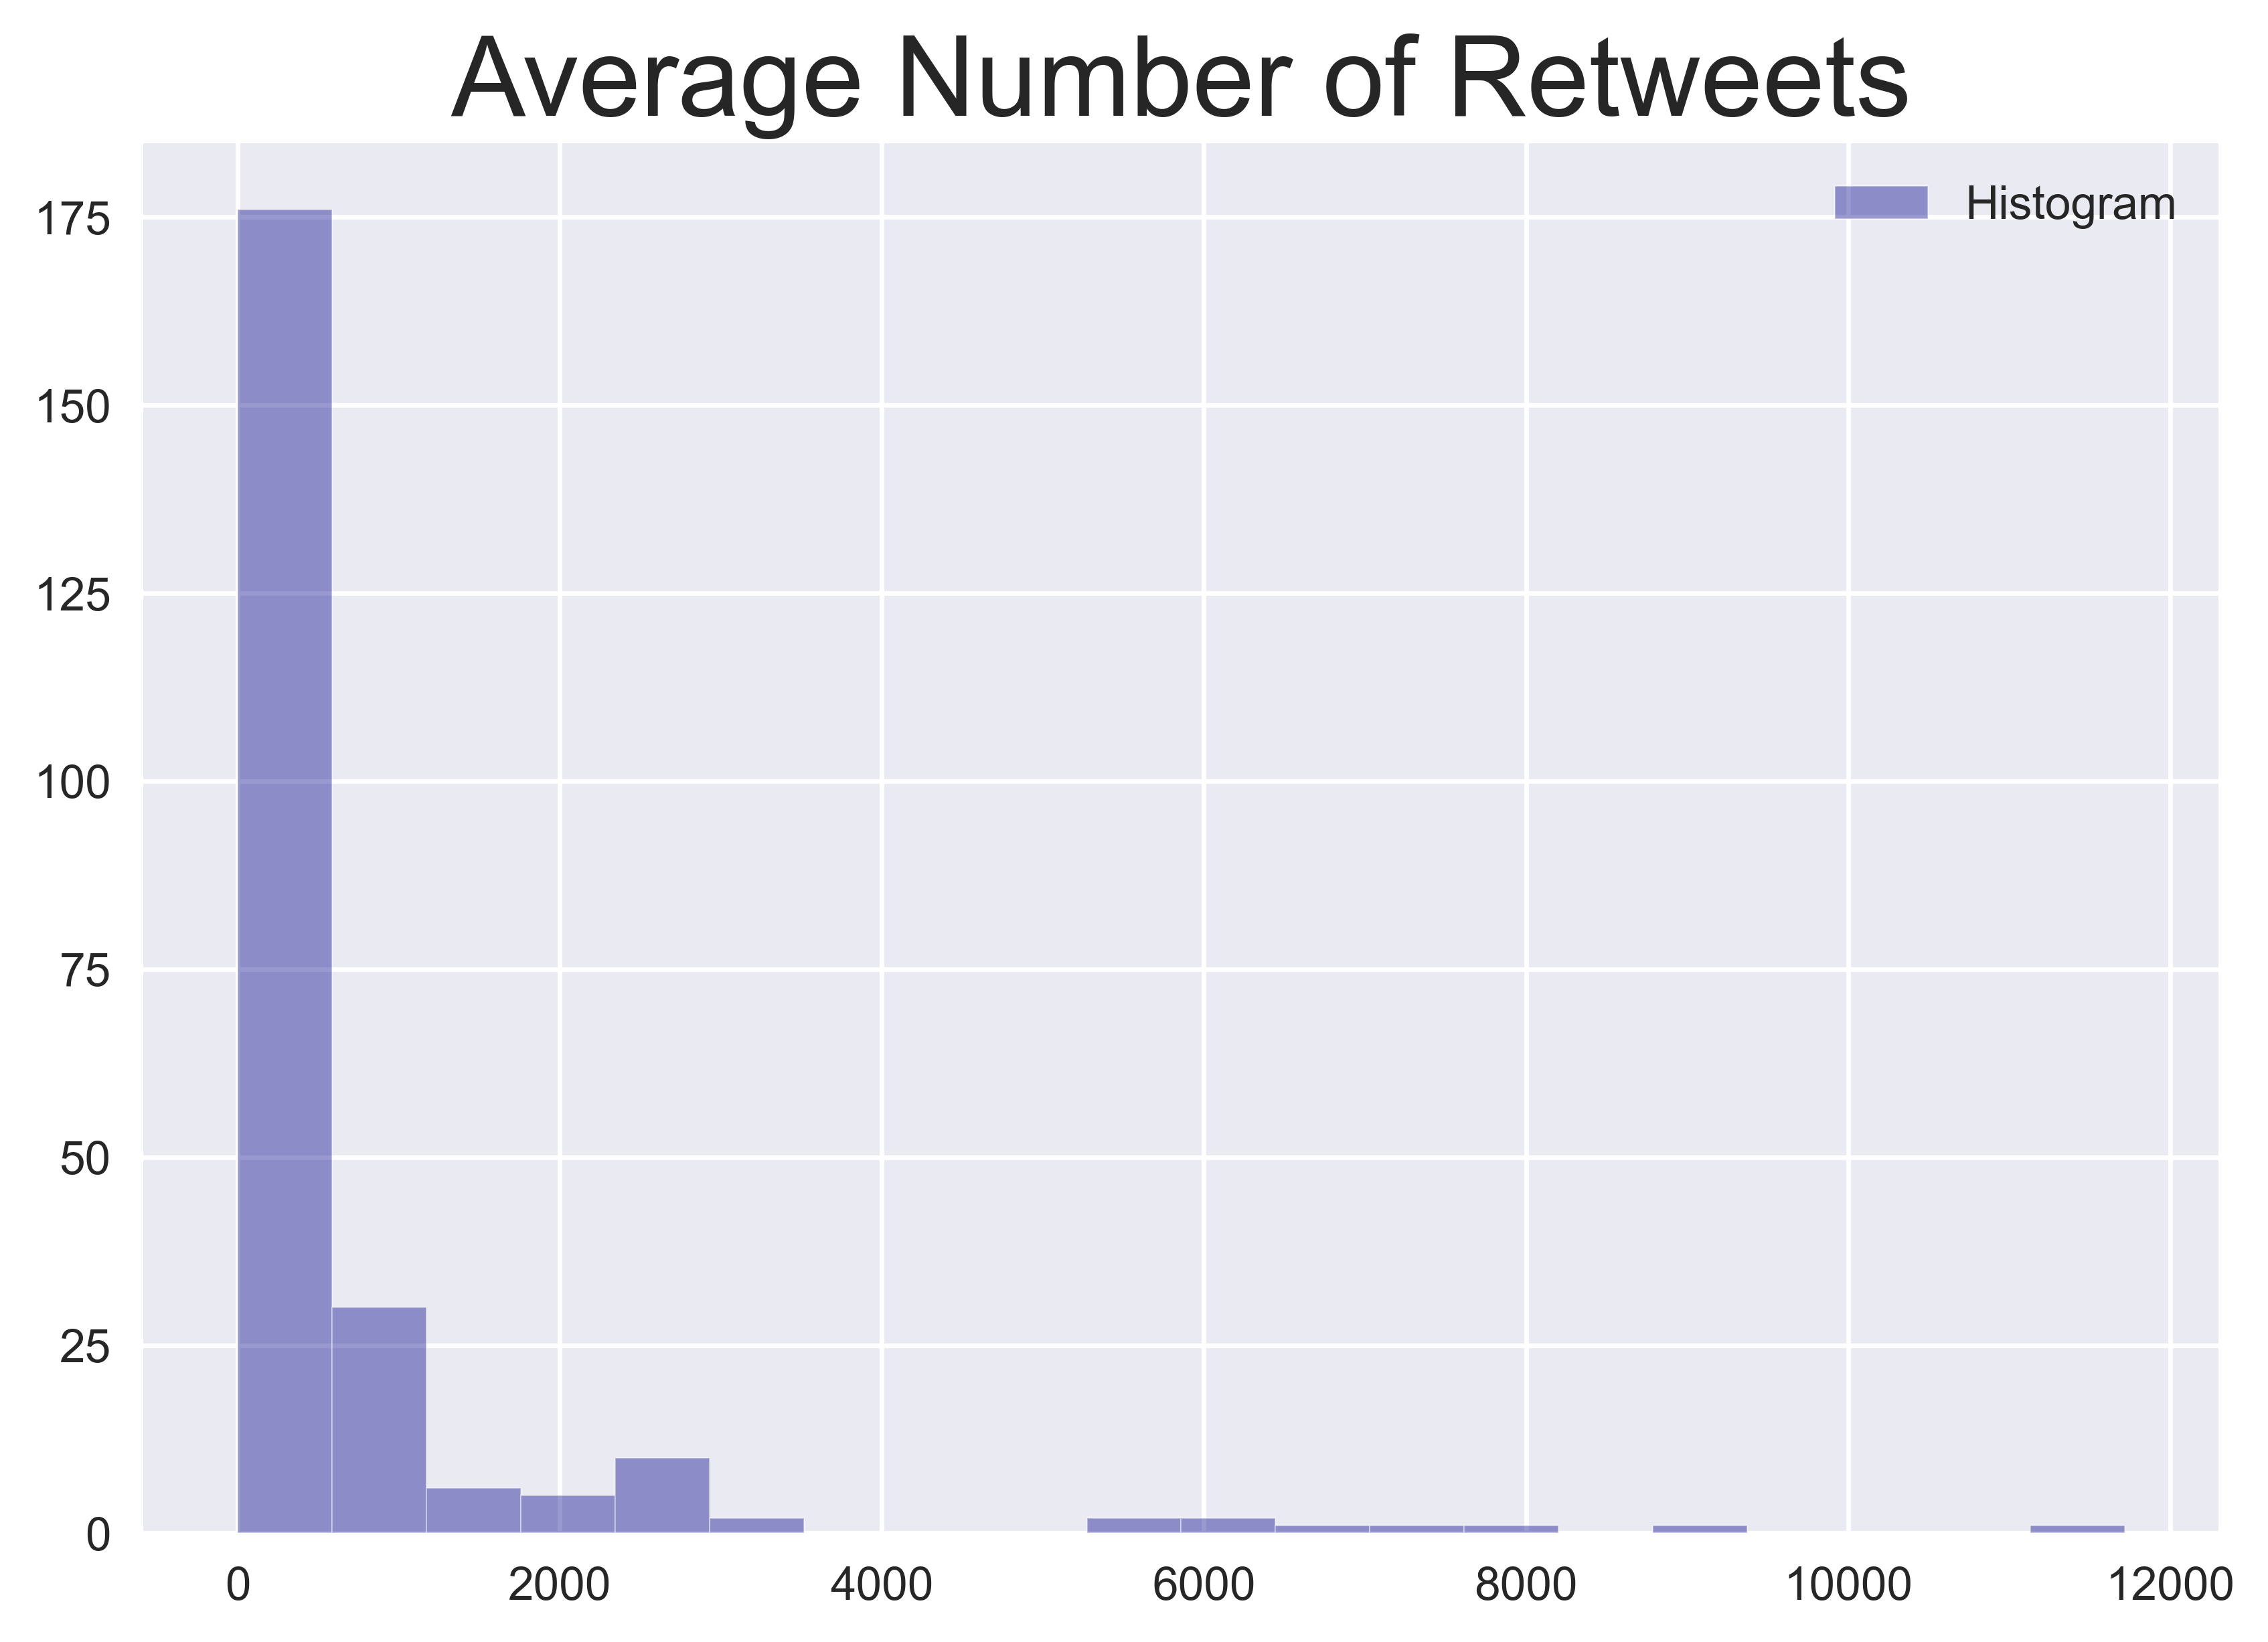
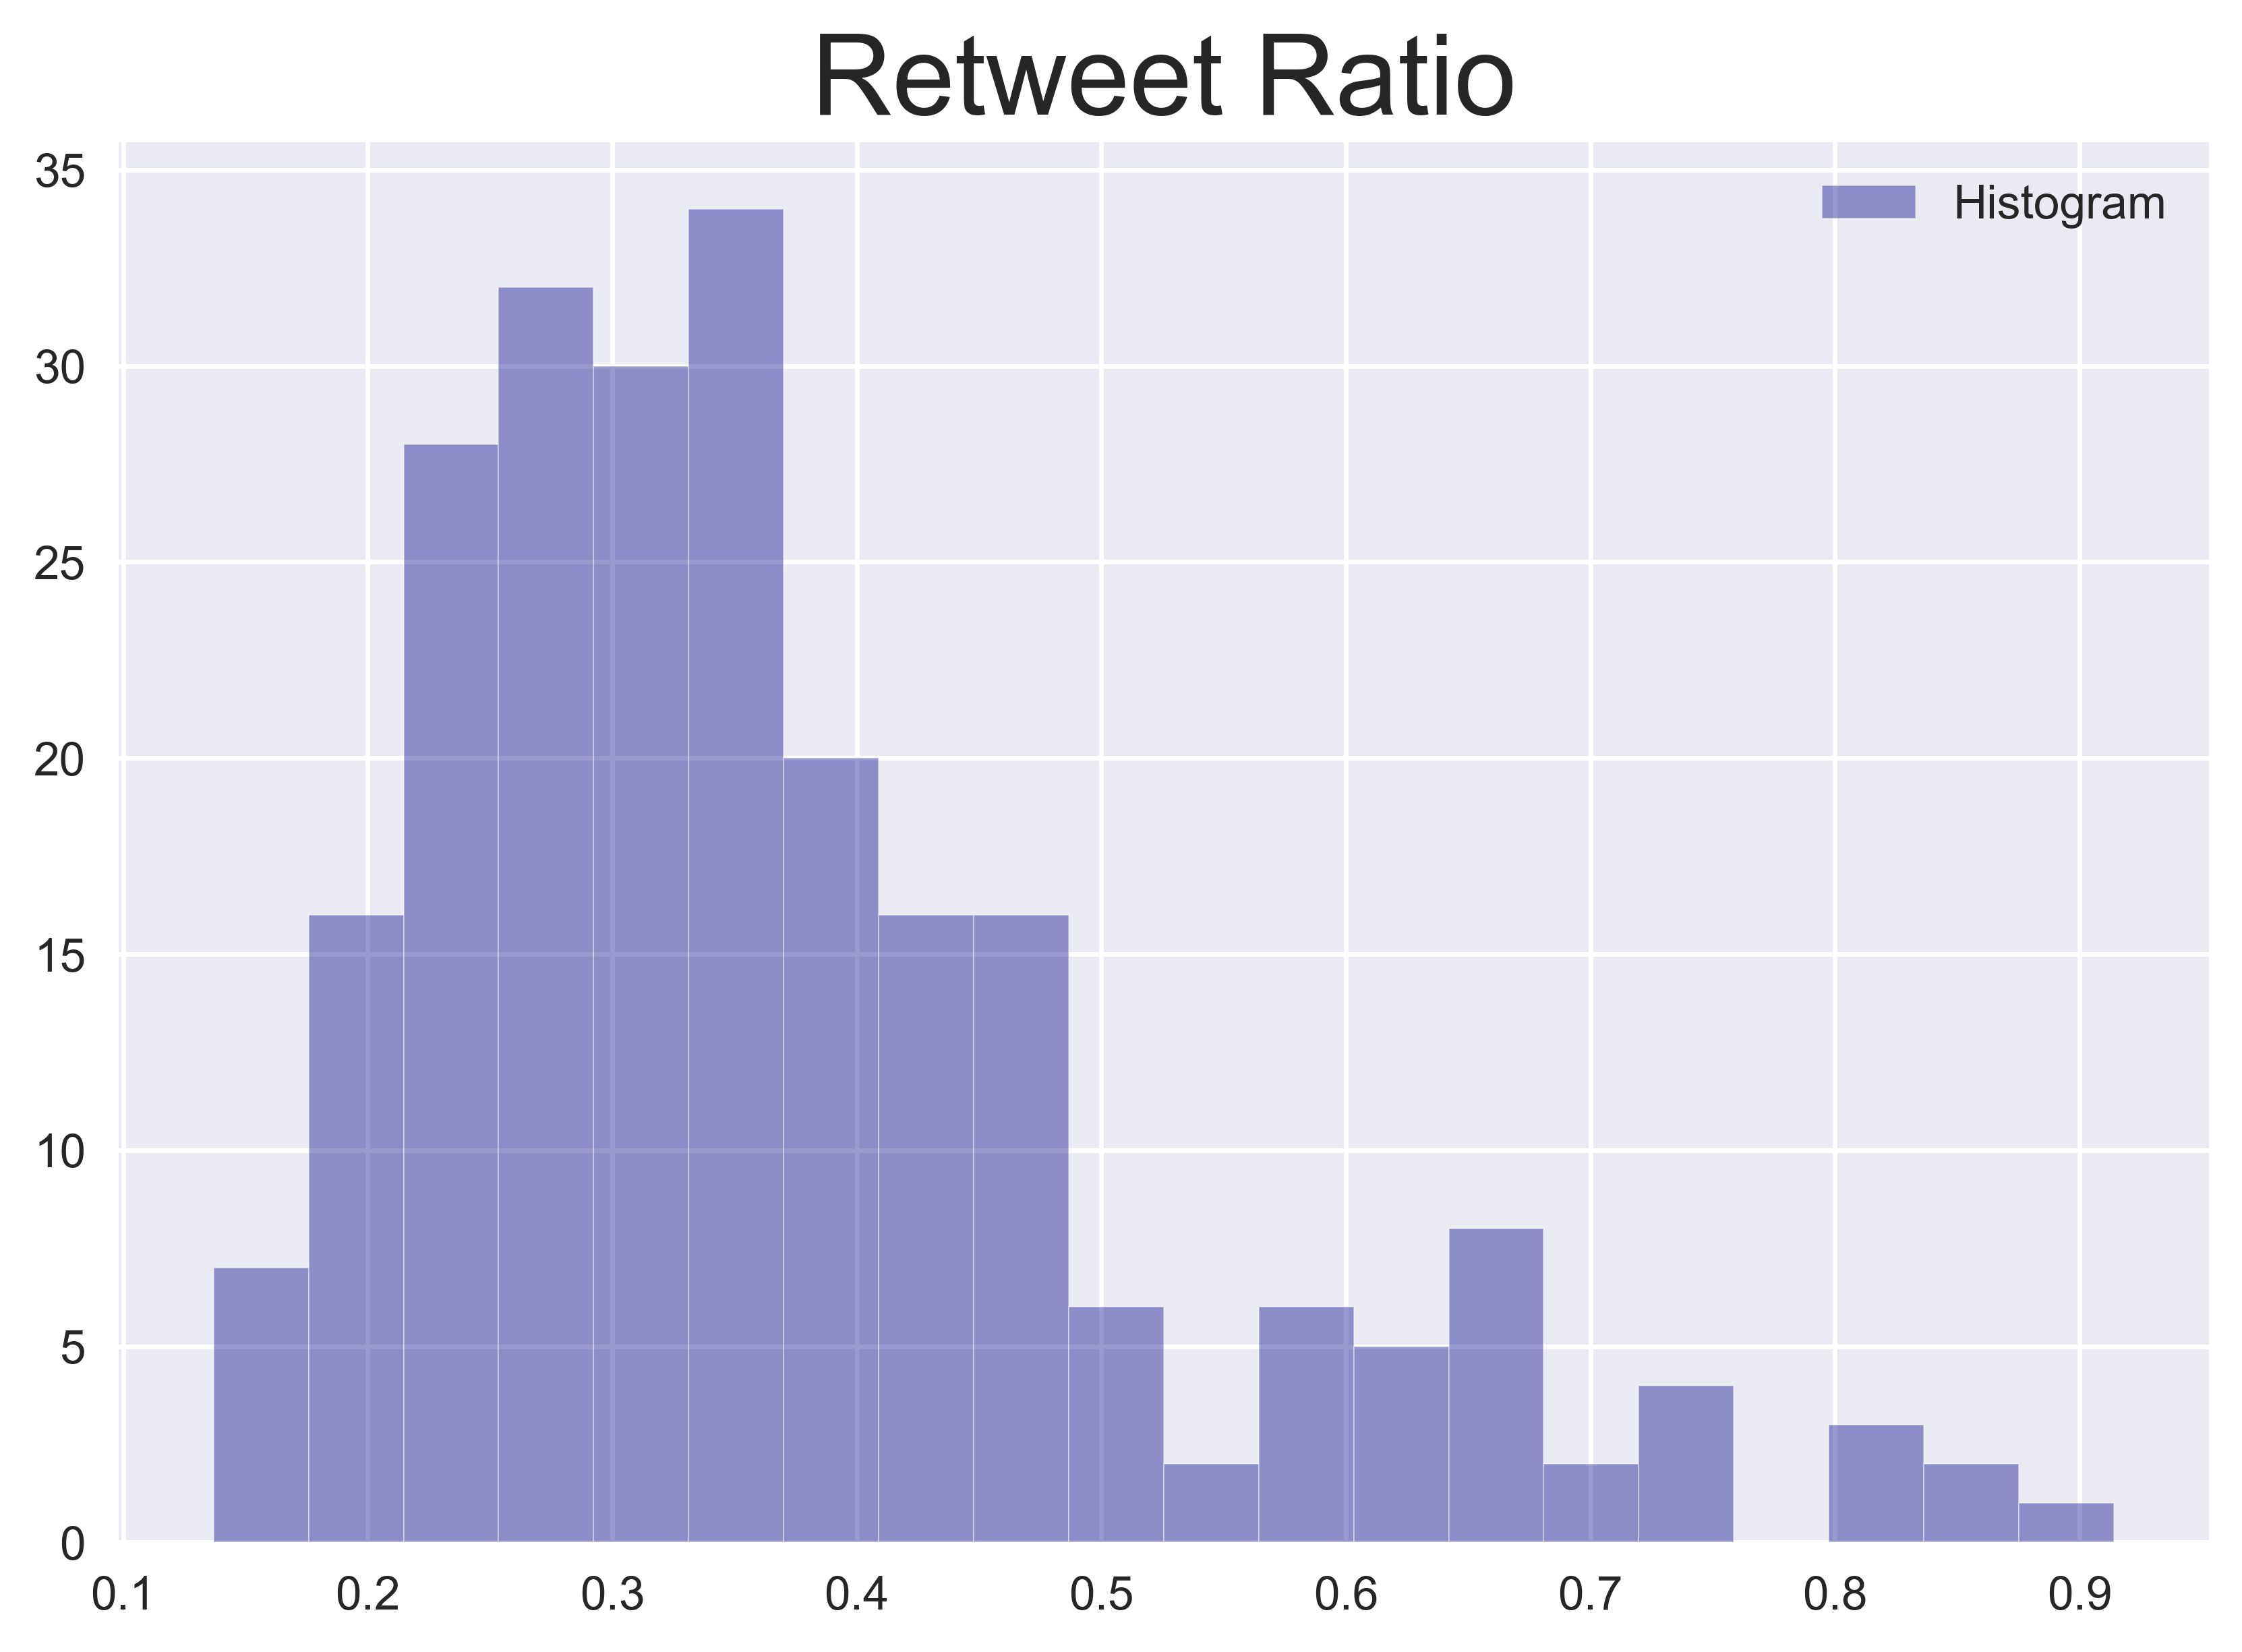
Another important Twitter function is the retweet. By extracting the retweet volume and its ratio to all tweets on a given day, I can capture whether a trending tweet or topic has gone viral, which increases its likelihood to have a social impact. To encapsulate this information, I calculate the average number of retweets and the ratio of retweets to all tweets for each day.
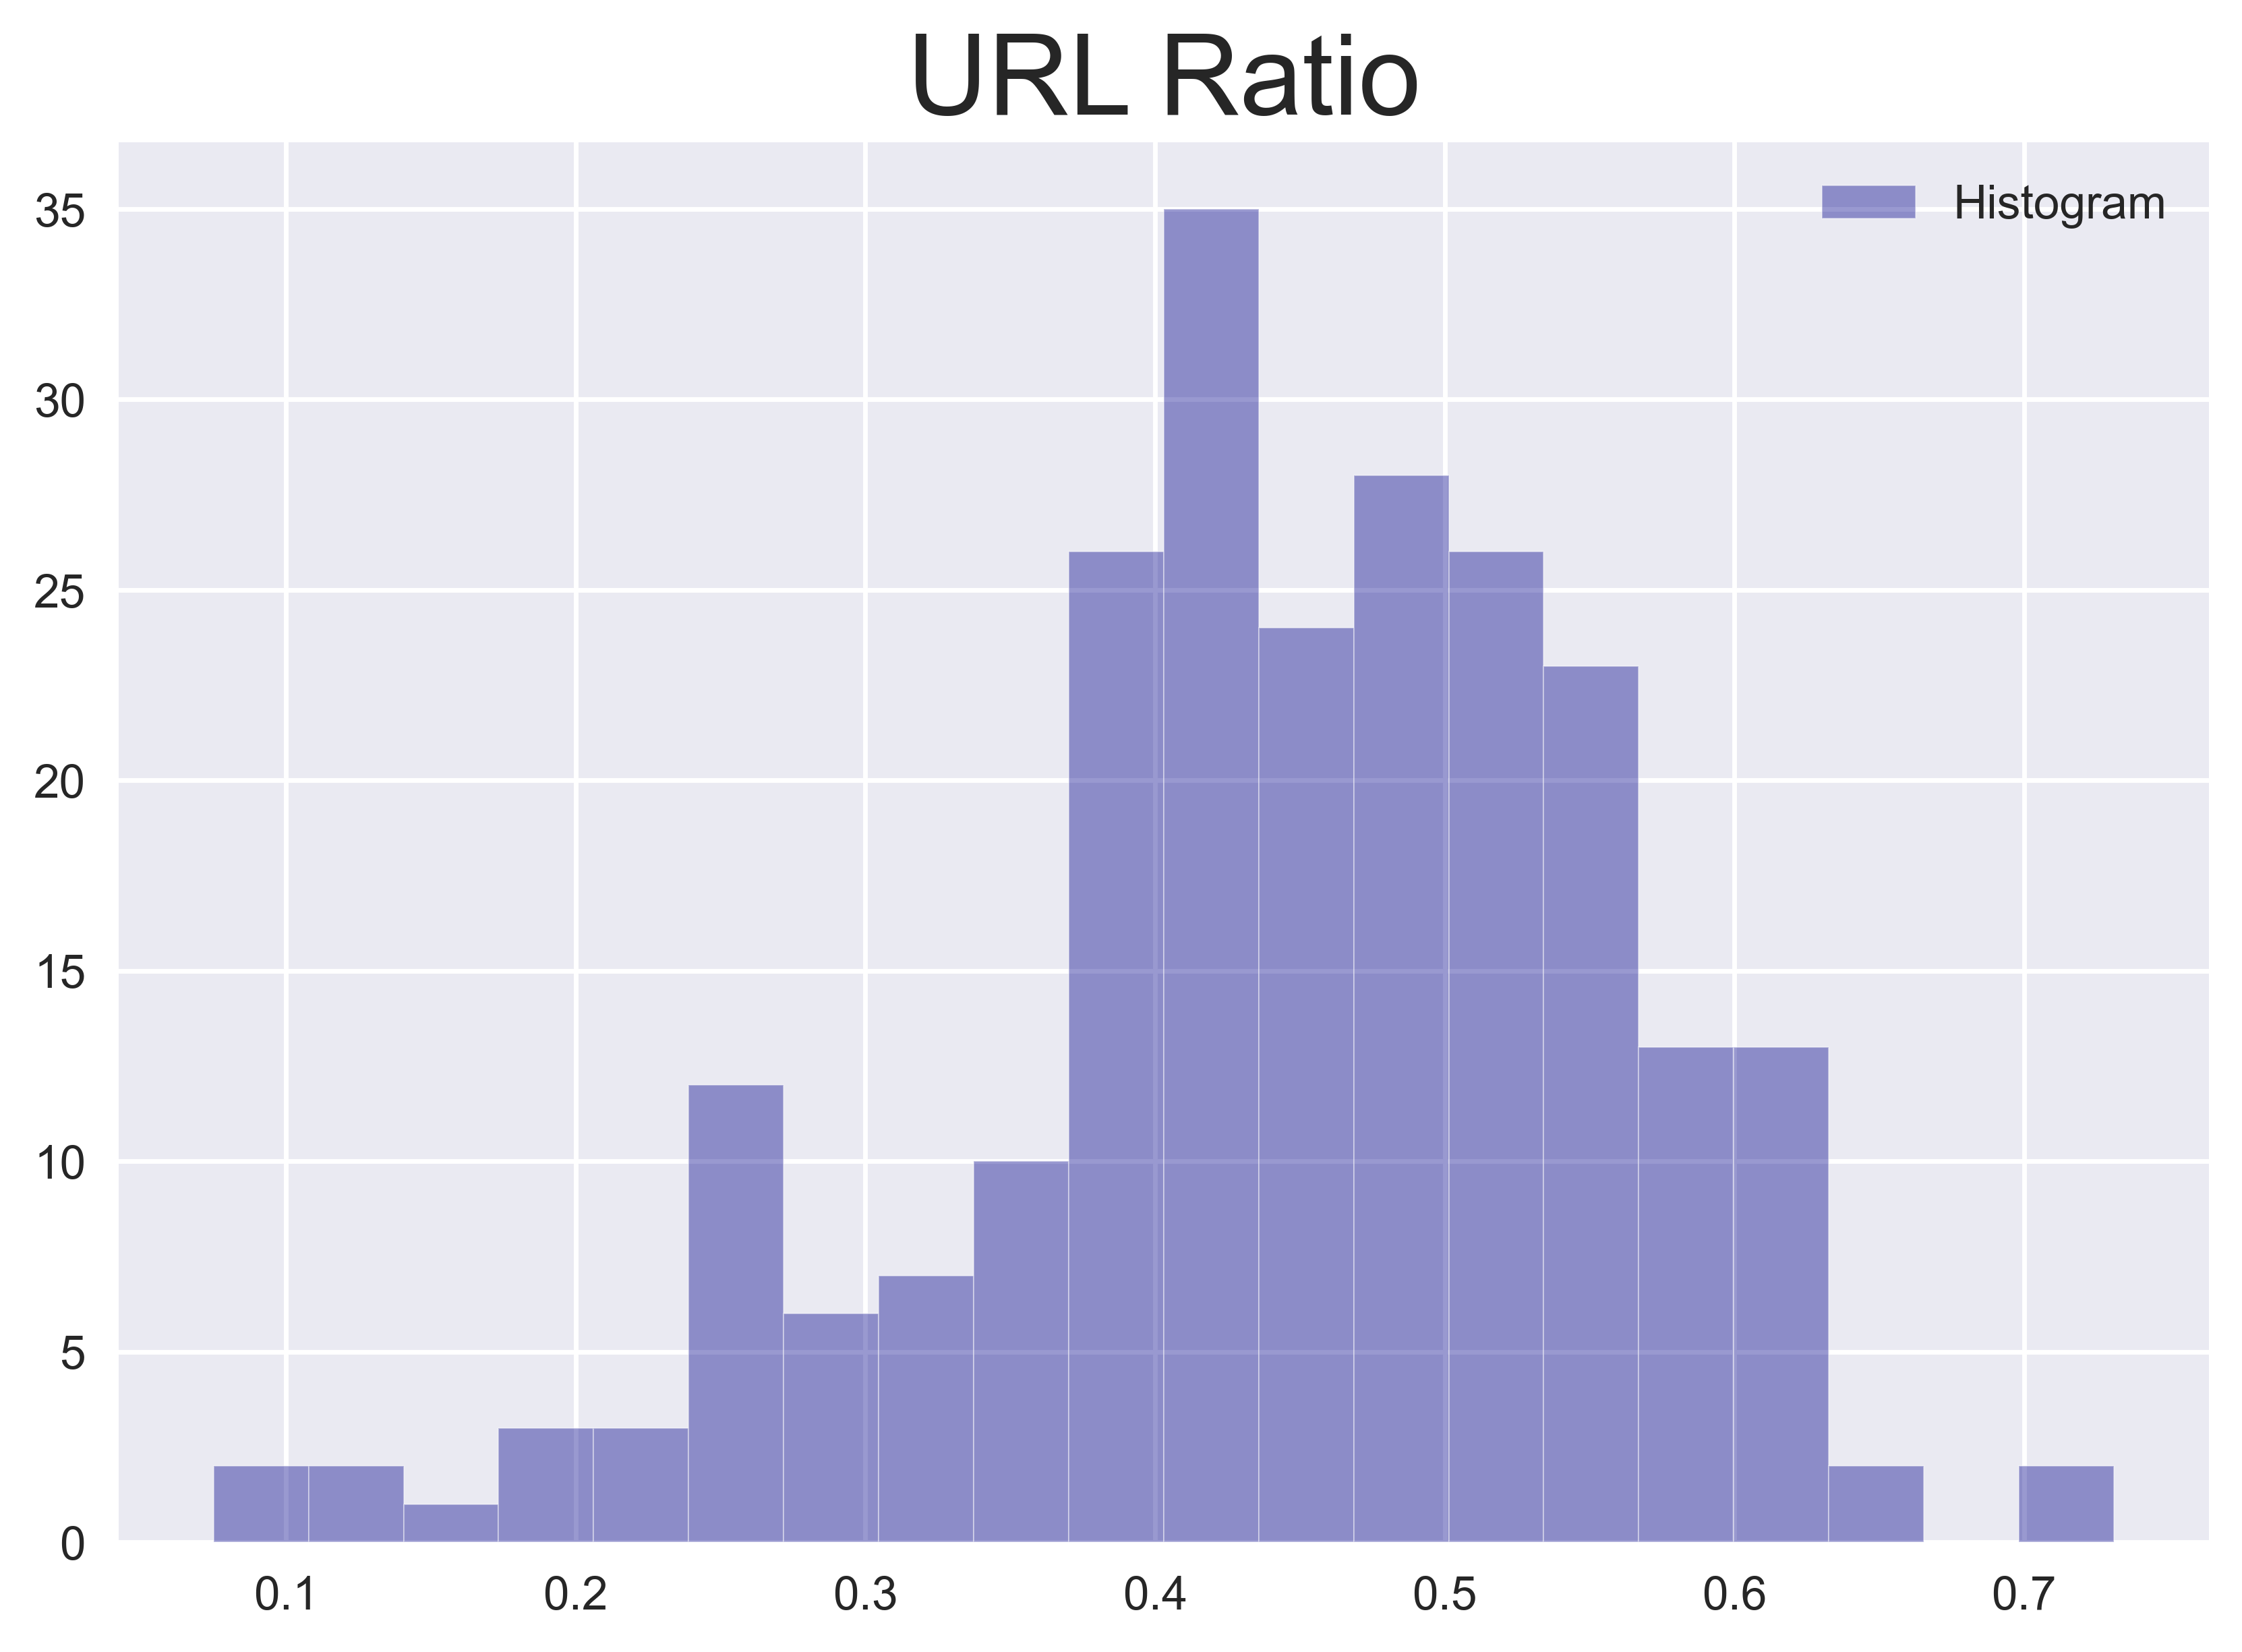
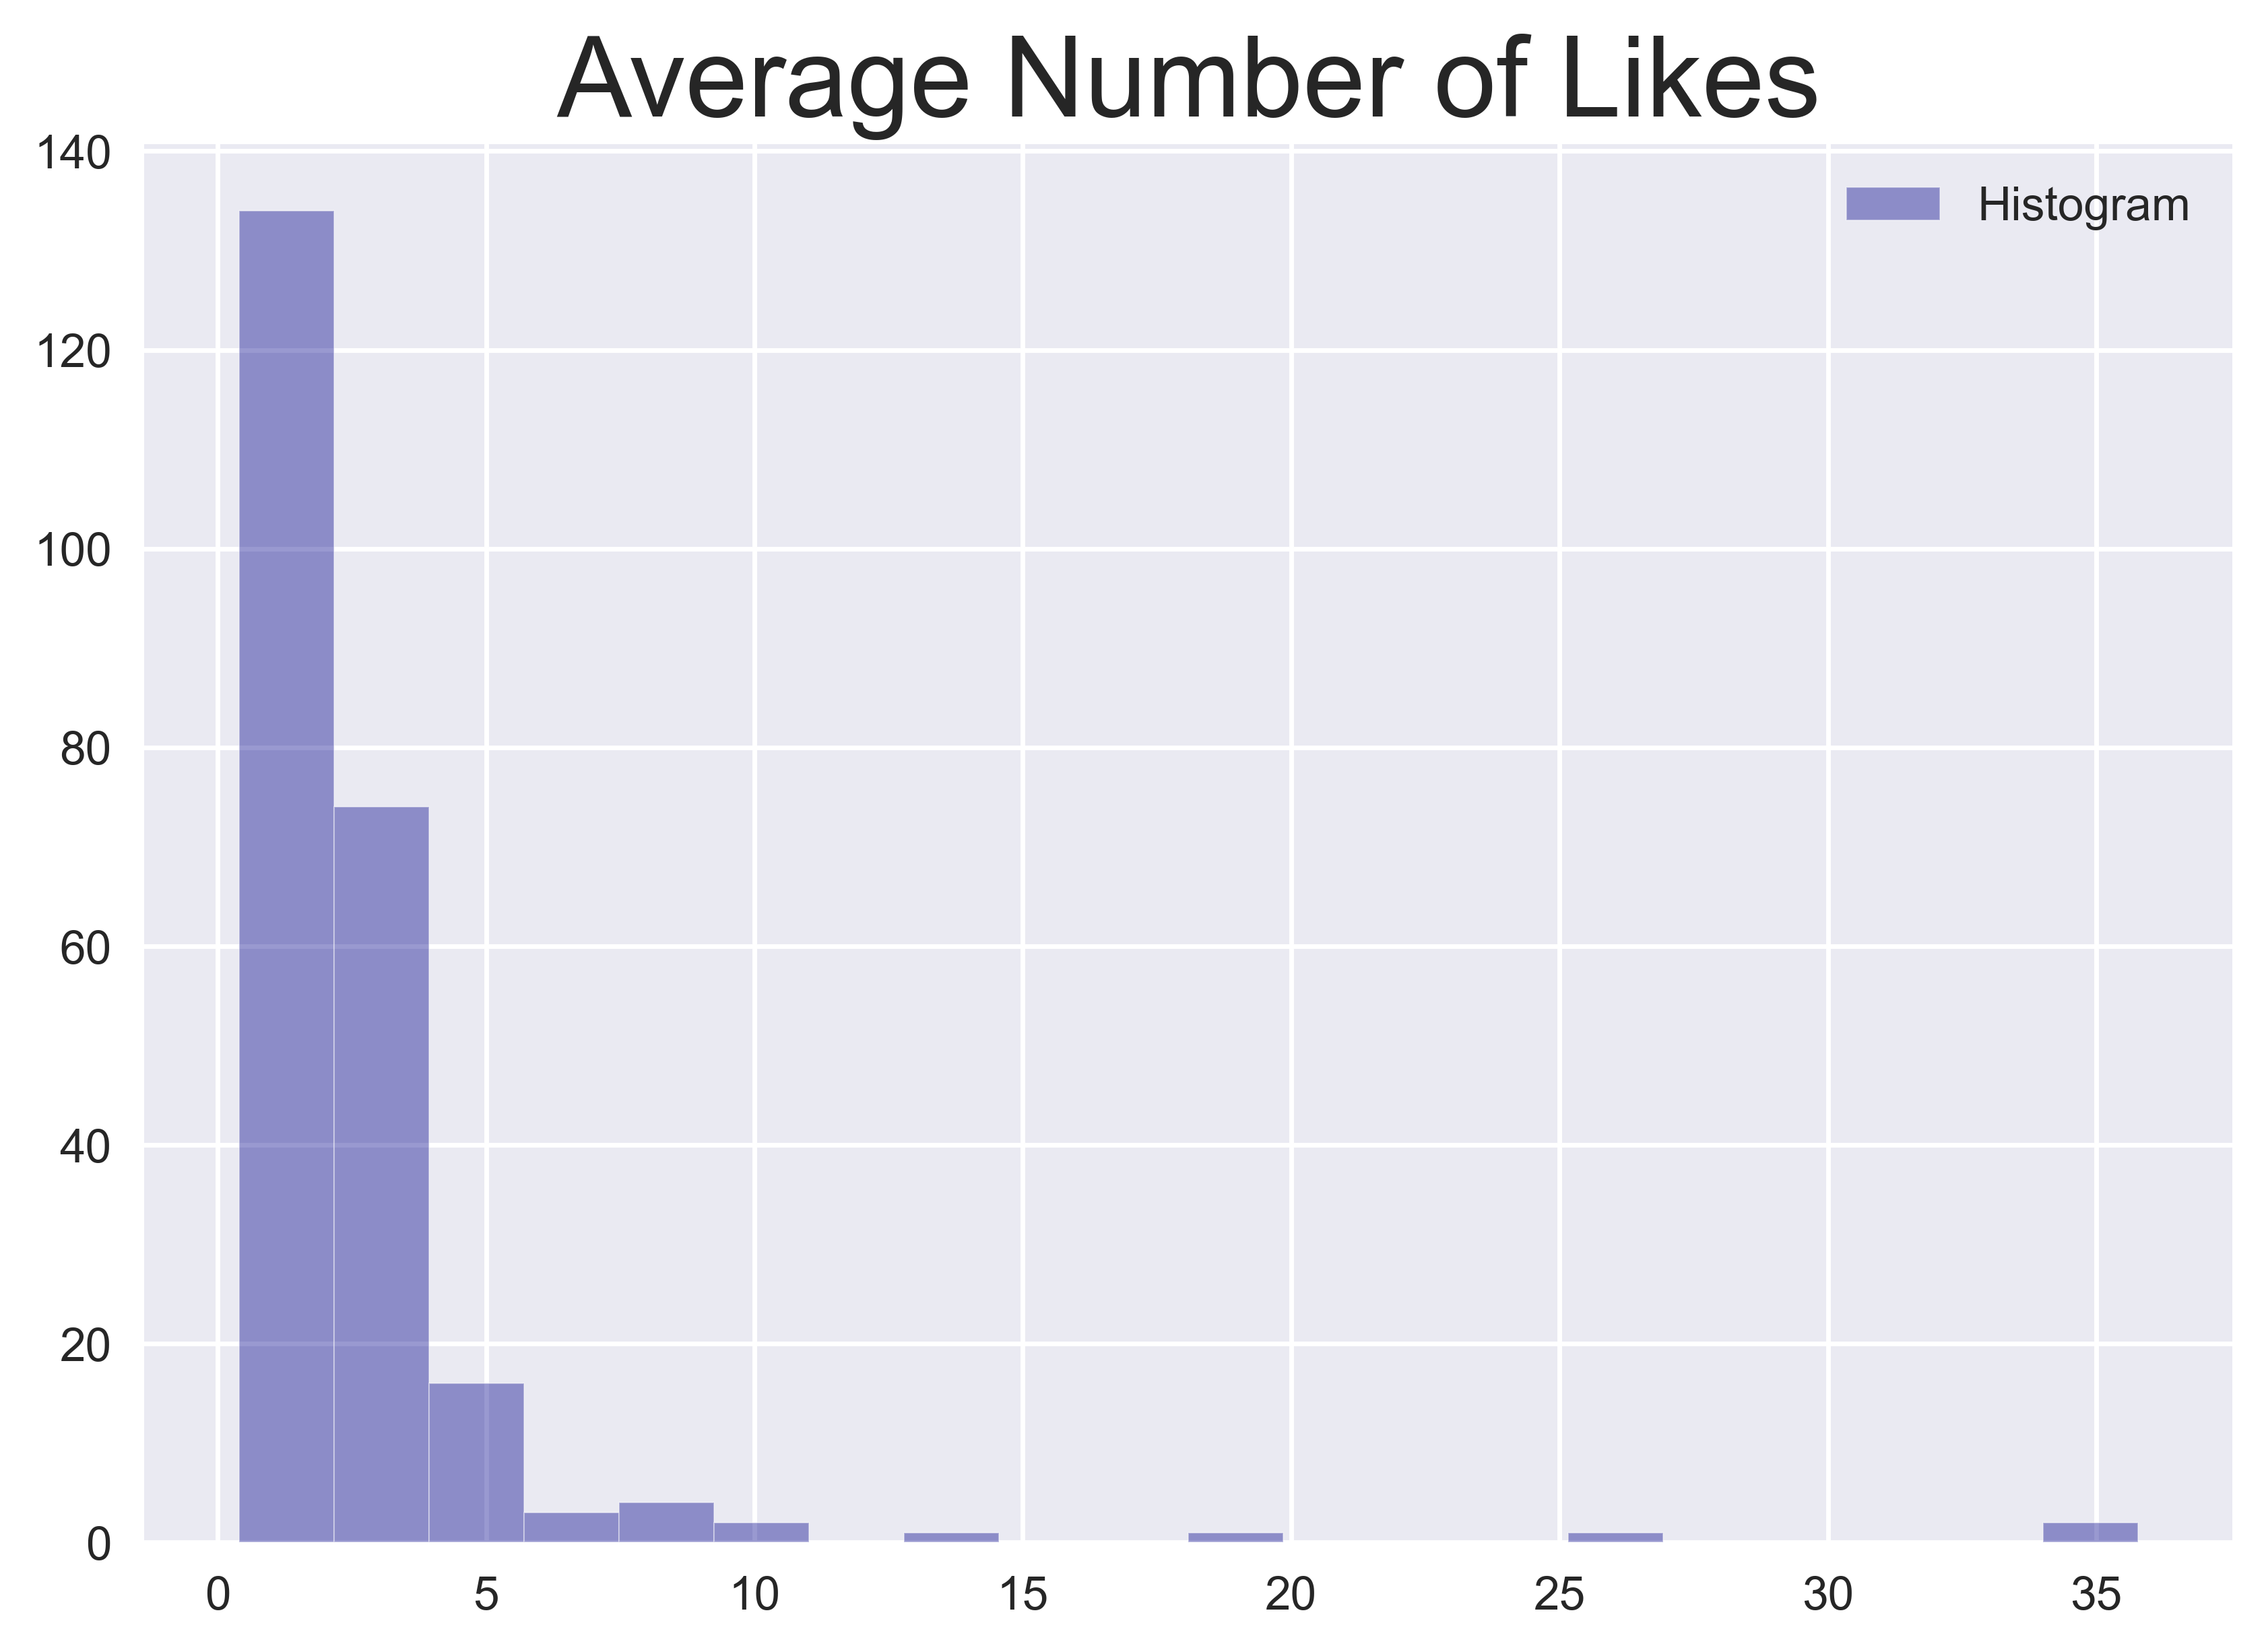
Similarly, shares of an external link (in the form of a URL) or likes of tweets carry information about what content has gained the most public attention on a given day. To capture this information, I calculate the percentage of tweets containing URLs to all tweets on a given day as the URL ratio and the average number of likes per tweet for each day.
3. Content-based Features
Let's now dive into the actual content of tweets and apply NLP techniques to the text. When we read a piece of text, we usually focus on the entities or subjects that are being discussed, what topics are being covered, and the opinion or sentiment that the author is trying to convey. This is automatically processed by our brains. NLP techniques allow machines to mimic the same function.
Named entities mentioned in tweets
Named entities (NEs) are a range of pre-defined categories mentioned in unstructured text, such as a person's name, organisations, locations, time expressions, quantities, monetary values, and percentages. The task of identifying, predicting, and extracting these NEs is known as Named Entity Recognition (NER). To demonstrate how this works, imagine I post the following tweet: "Last week, I met Tim at the London Stock Exchange in London". As seen in the next image, NER is able to categorise the content of this tweet into the NEs described in the table below.

From this, I can begin to understand the actual content of a tweet. Using NER, I can create features that describe what type of subjects are discussed. These different entity types might have different impacts for a specific company.
| TYPE | DESCRIPTION |
|---|---|
| Date | Absolute or relative dates or periods. |
| Event | Named hurricanes, battles, wars, sports events, etc. |
| GPE | Geopolitical entity i.e. countries, cities, states. |
| Location | Non-GPE locations, mountain ranges, bodies of water. |
| Money | Monetary values, including unit. |
| NORP | Nationalities or religious or political groups. |
| Organisation | Companies, agencies, institutions, etc. |
| Percentage | Percentage, including "%". |
| Product | Objects, vehicles, foods, etc. (Not services.) |
| Person | People, including fictional. |
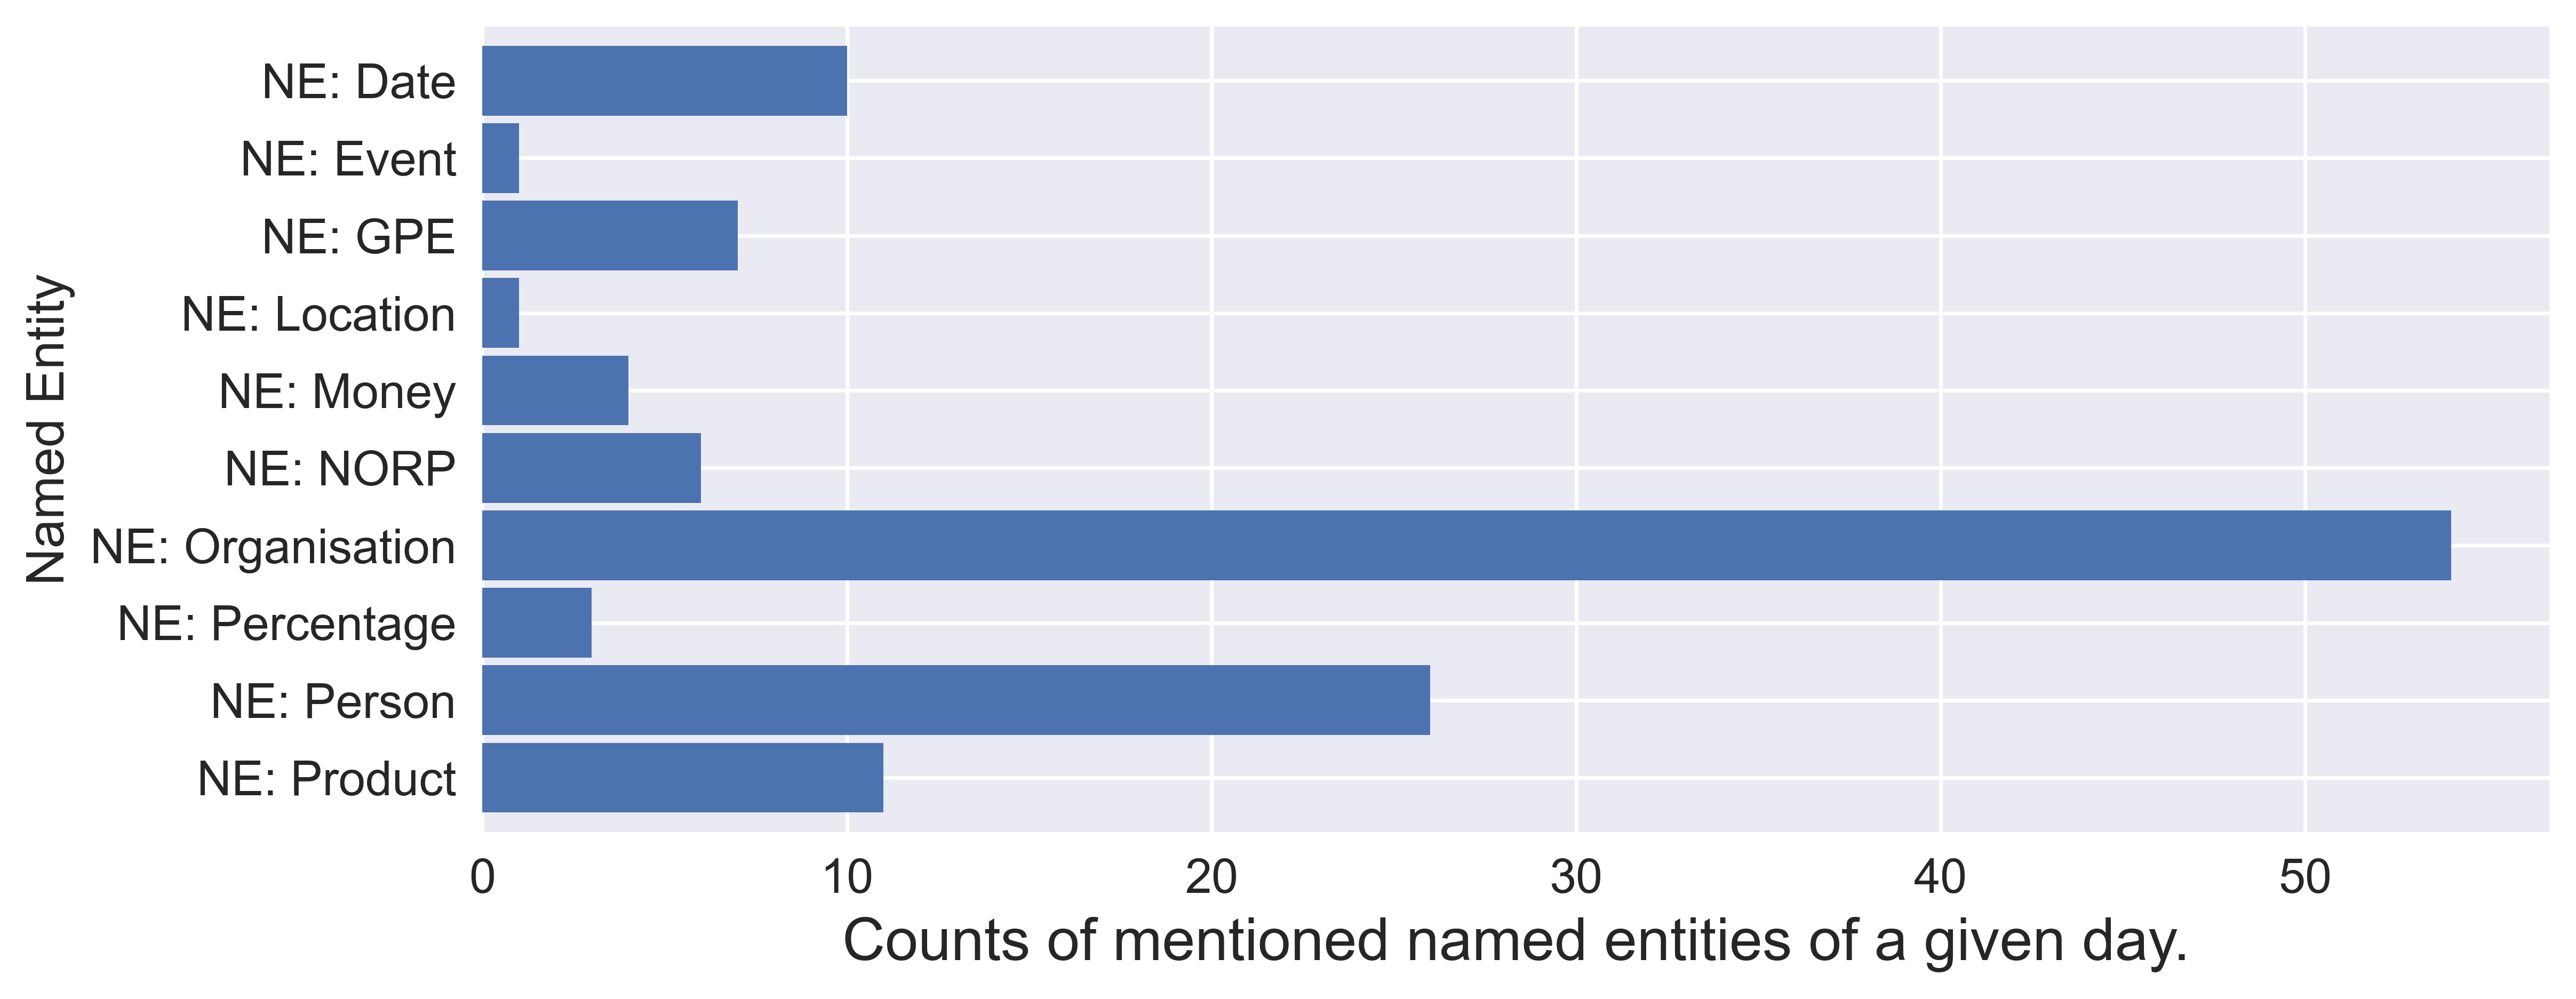
With the NER tagger from spacy (a Python package for NLP), a total of 20 entity types are recognised from our daily tweets. I pick some common ones in the table below that seem reasonable to experiment with. For each entity type, I accumulate the counts from tweets on the same day and create 10 NE features for each day.
Topics / Clusters
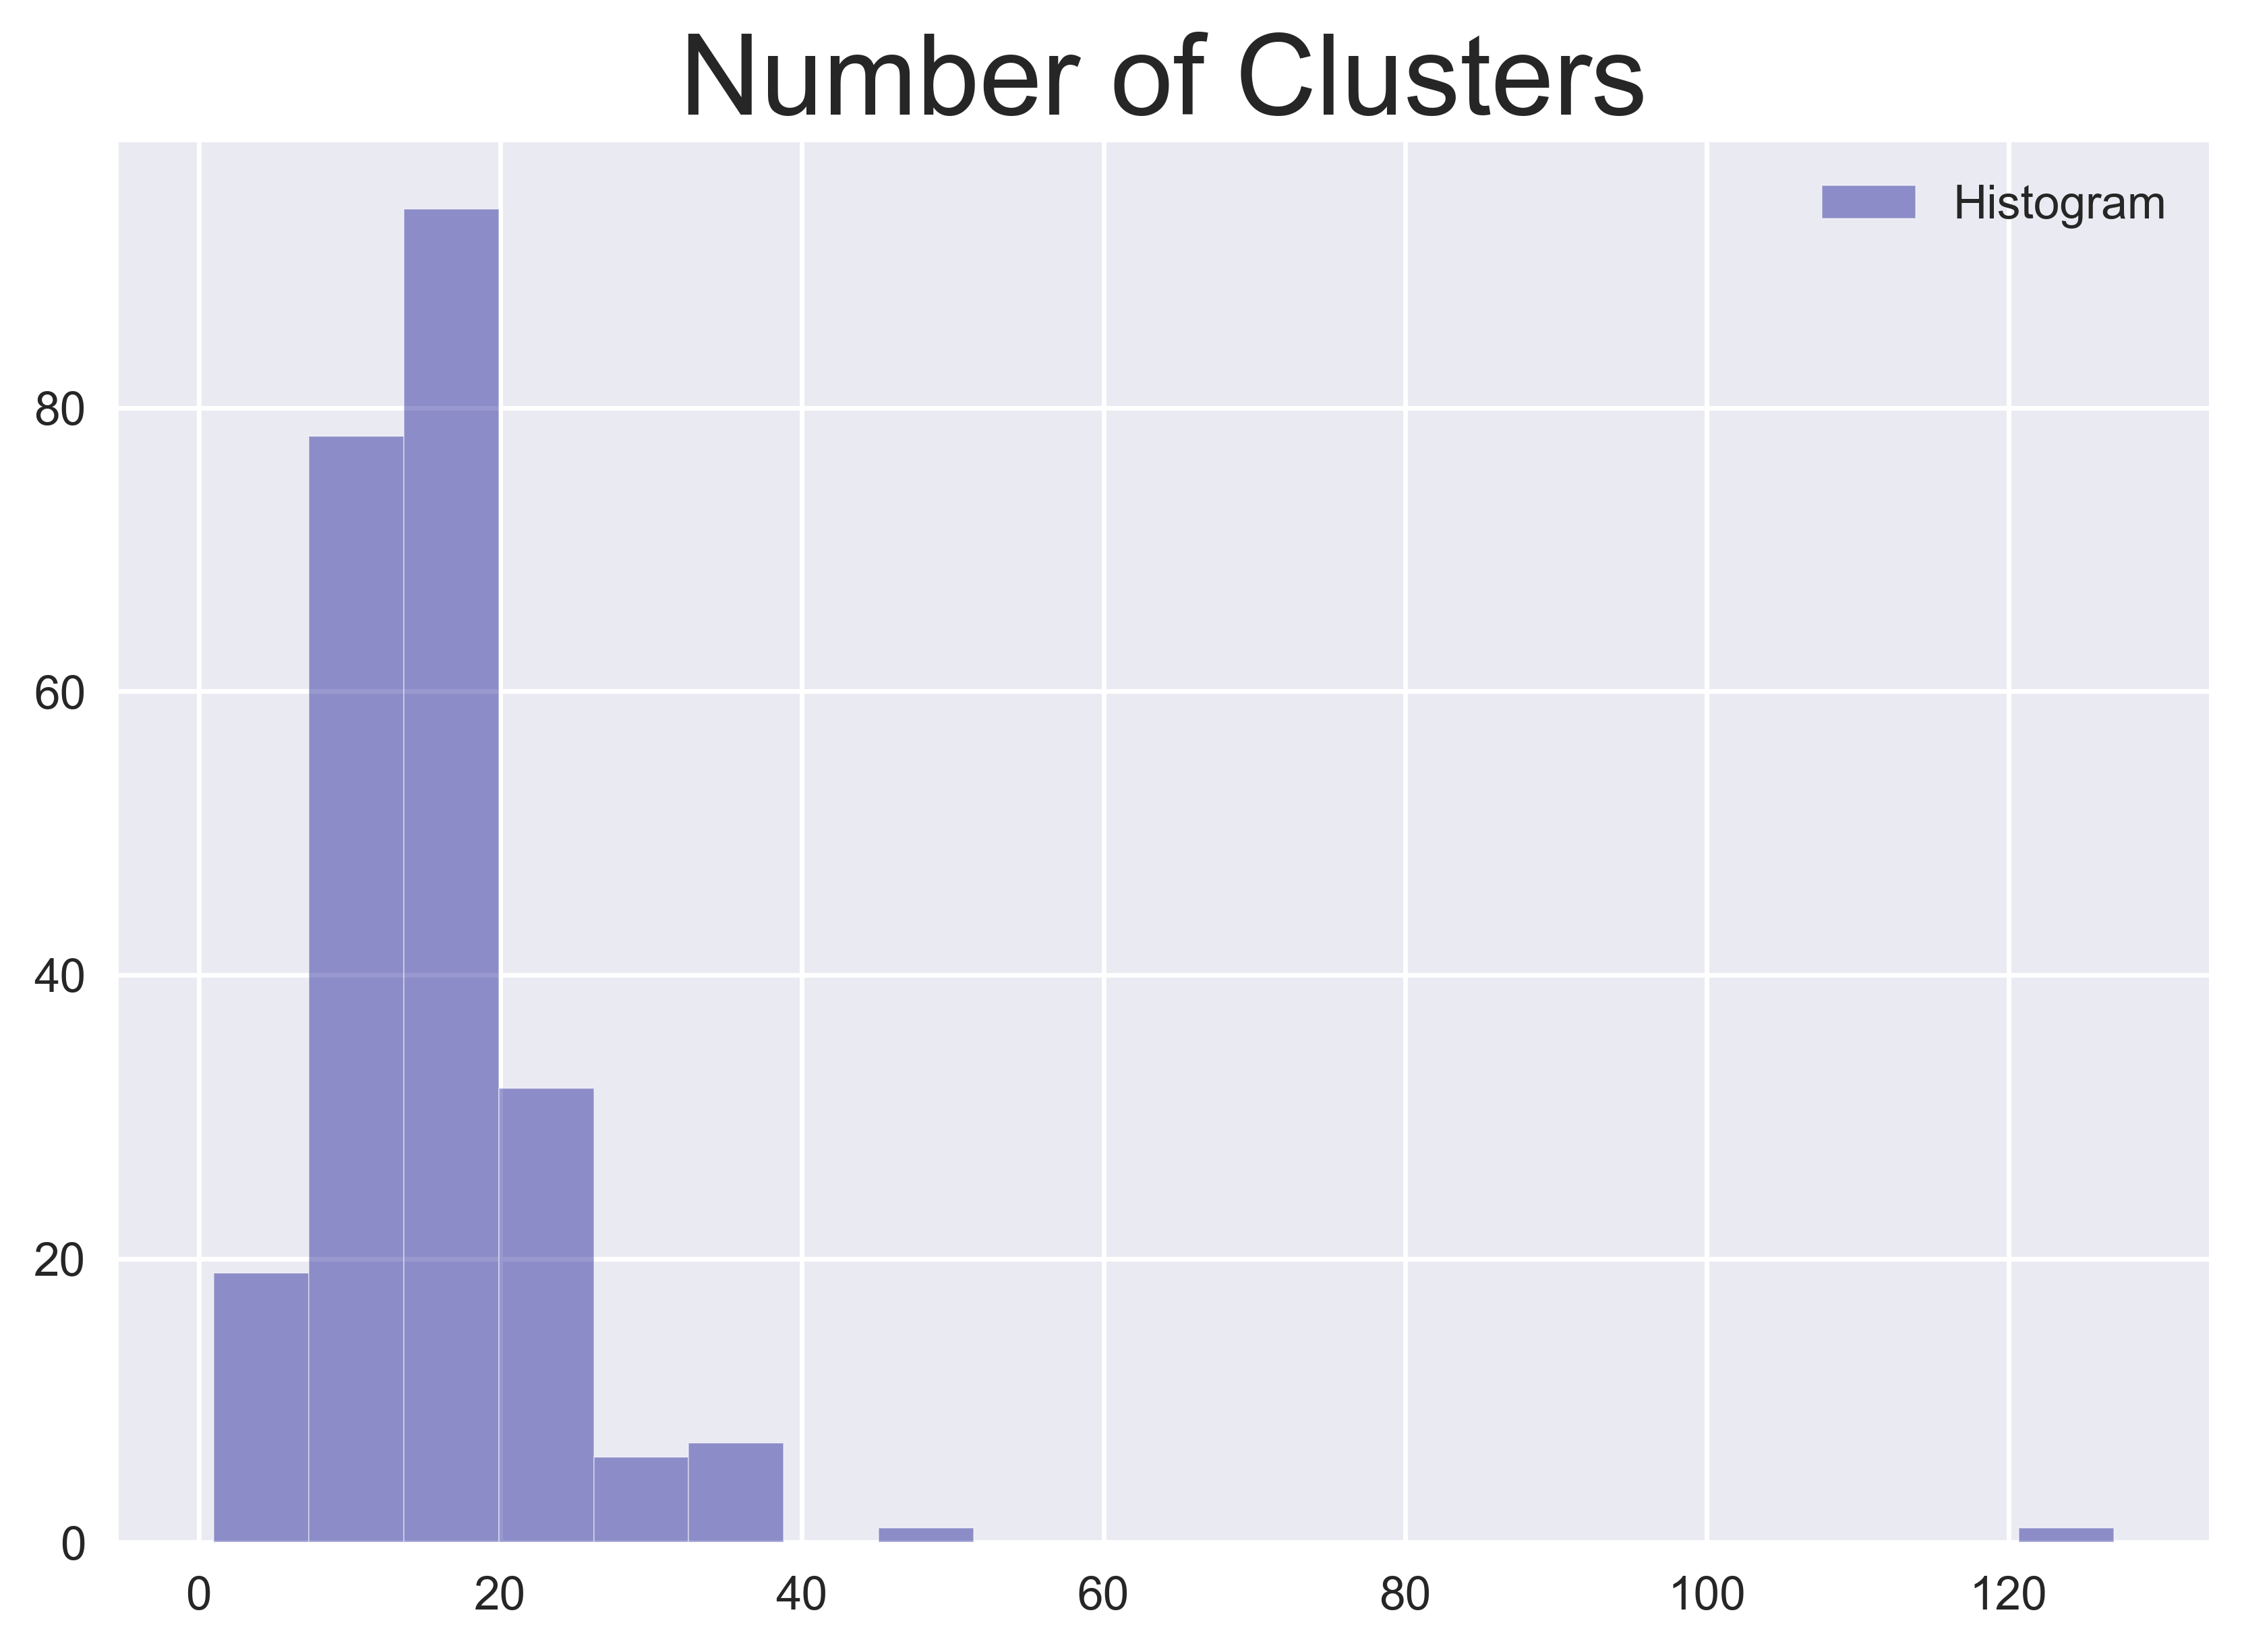
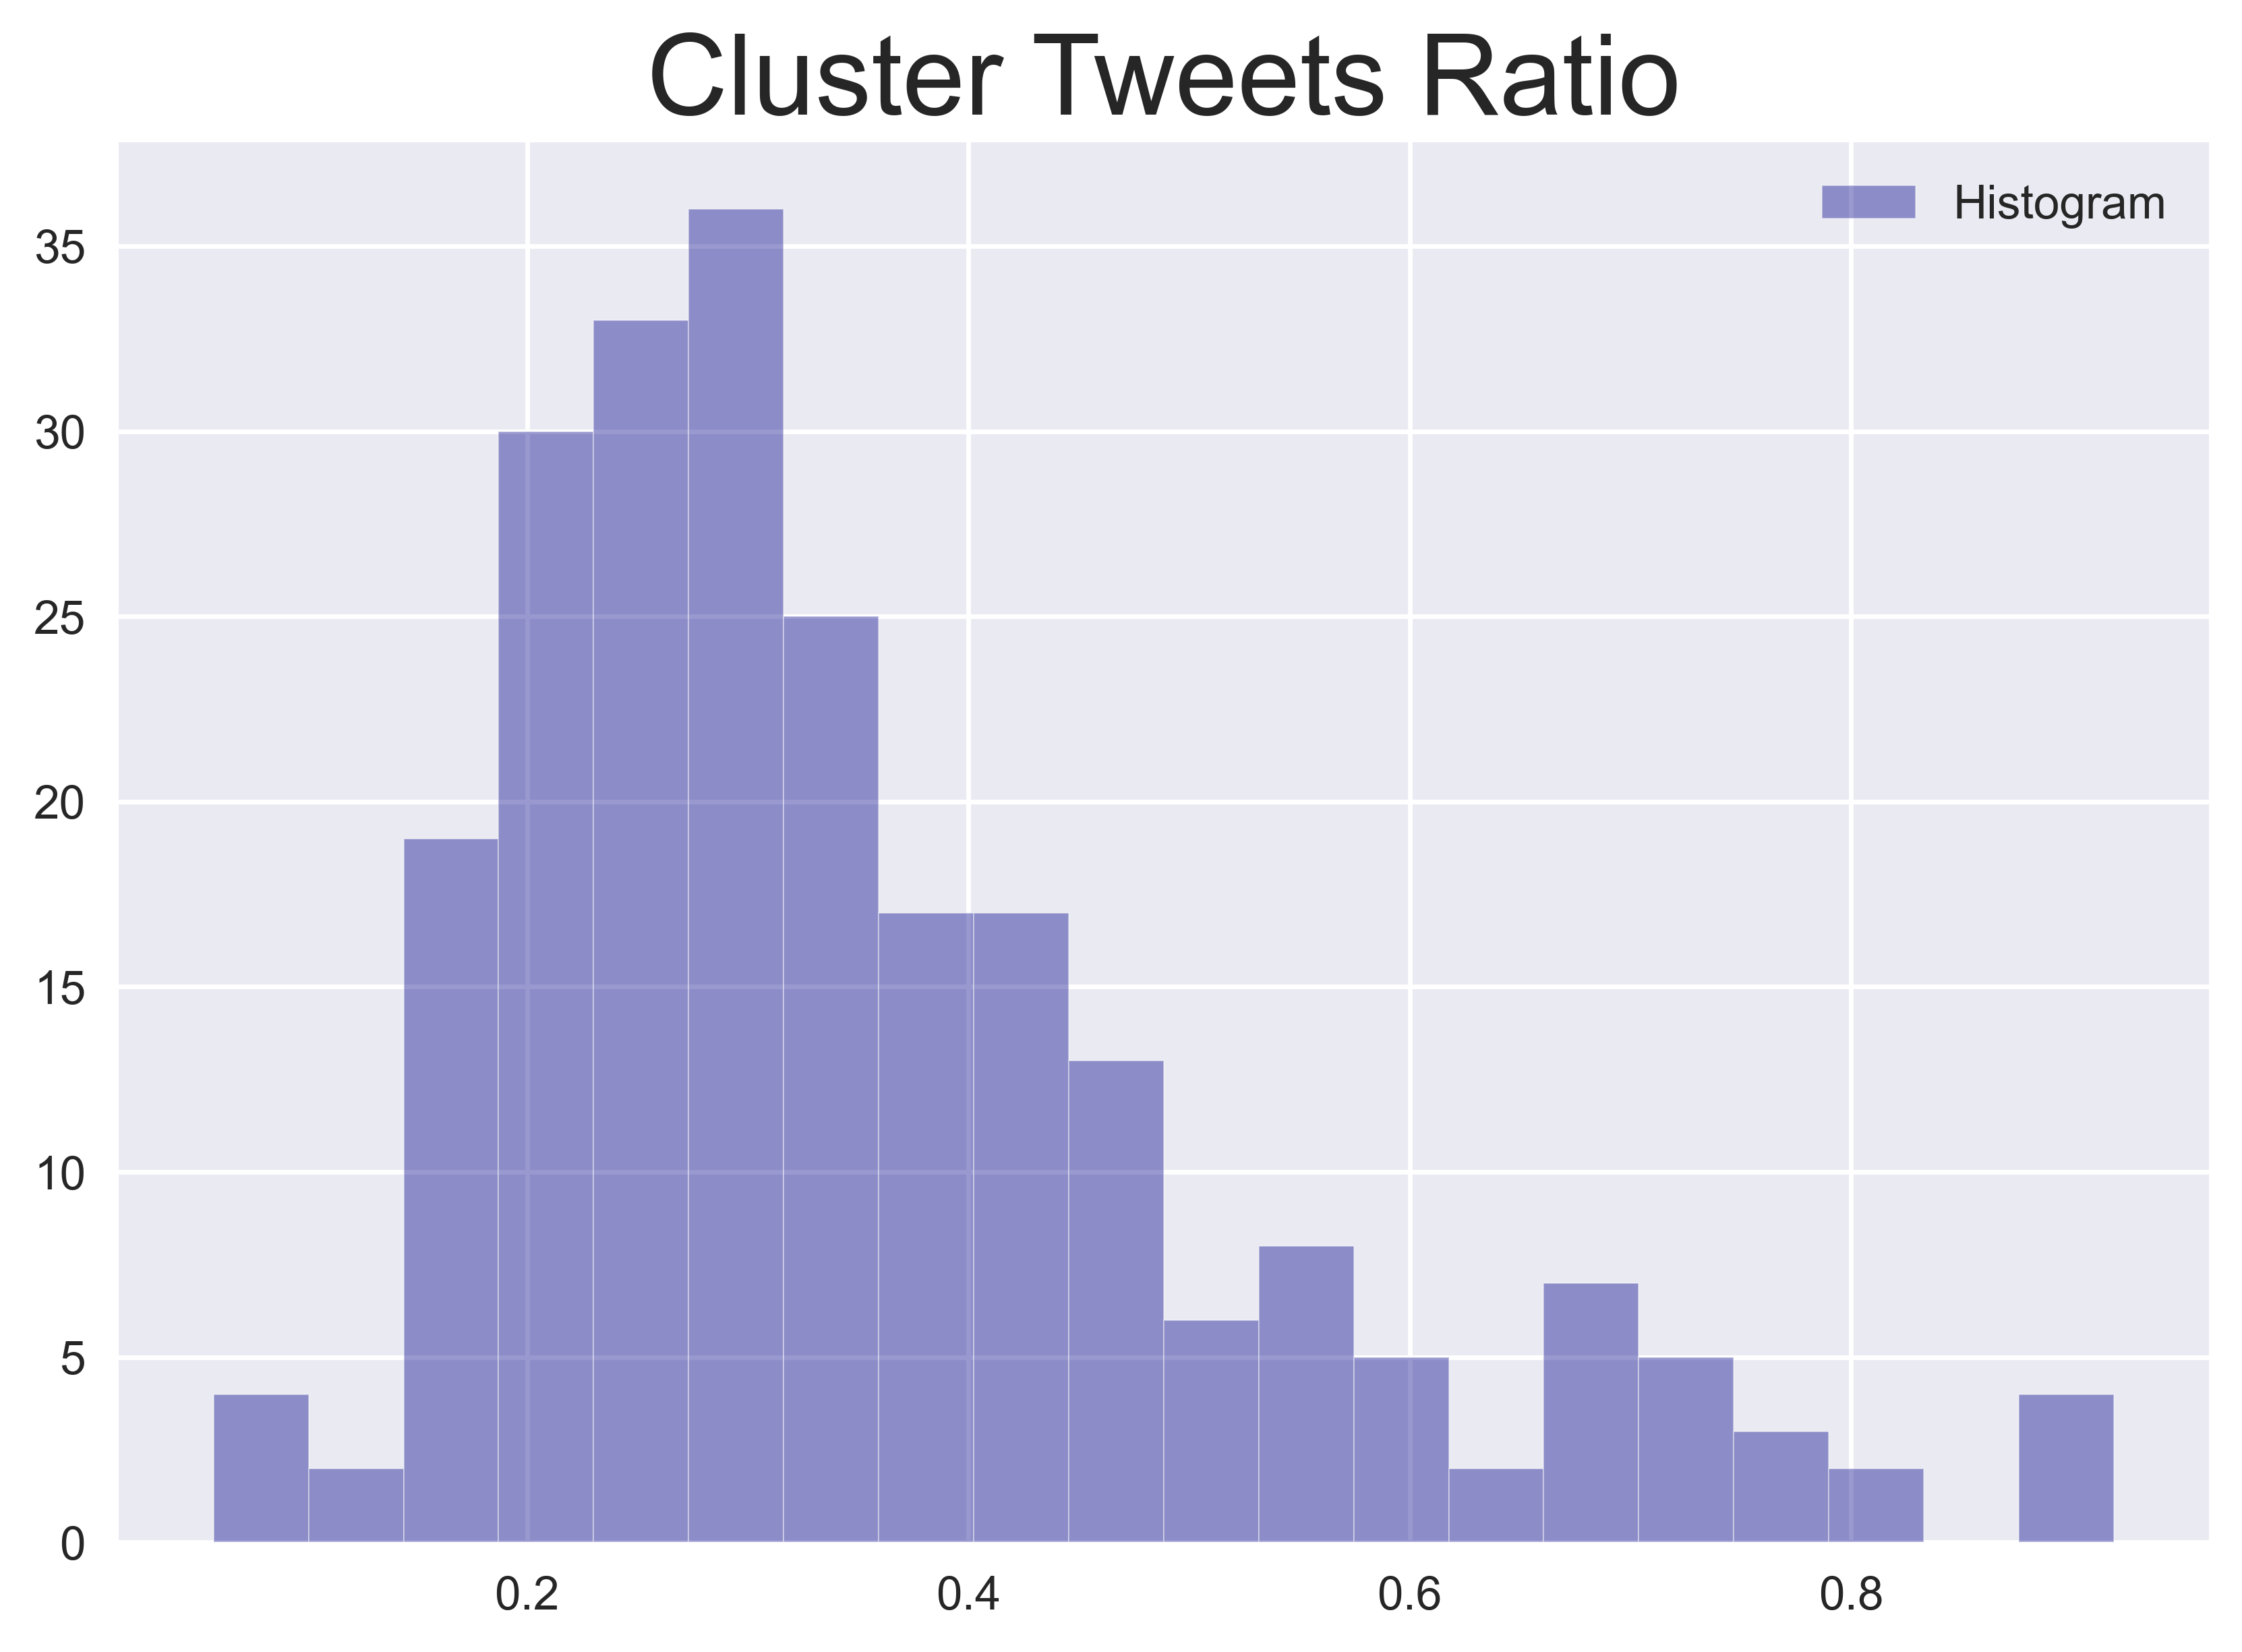
To capture what the public talks about on a given day, topic modelling or clustering can be employed to separate the tweet stream into smaller and more specific "sub-streams". From these sub-streams, you can create more complicated features and models. In this category, financial event detection on Twitter alone is a popular and fast-growing research area. However, for this demonstration, I use a simpler method to extract features. Without going into too much detail, I generate term frequency–inverse document frequency (tf-idf) vectors for each tweet and feed them into DBSCAN to identify the number of clusters. For all tweets (with duplication i.e. retweets), I allocate each tweet to its cluster and calculate the ratio of these tweets to all tweets. These features describe how many mainstream topics are expressed by the Twitter public on a given day and the proportion of engagement on these topics.
Sentiment
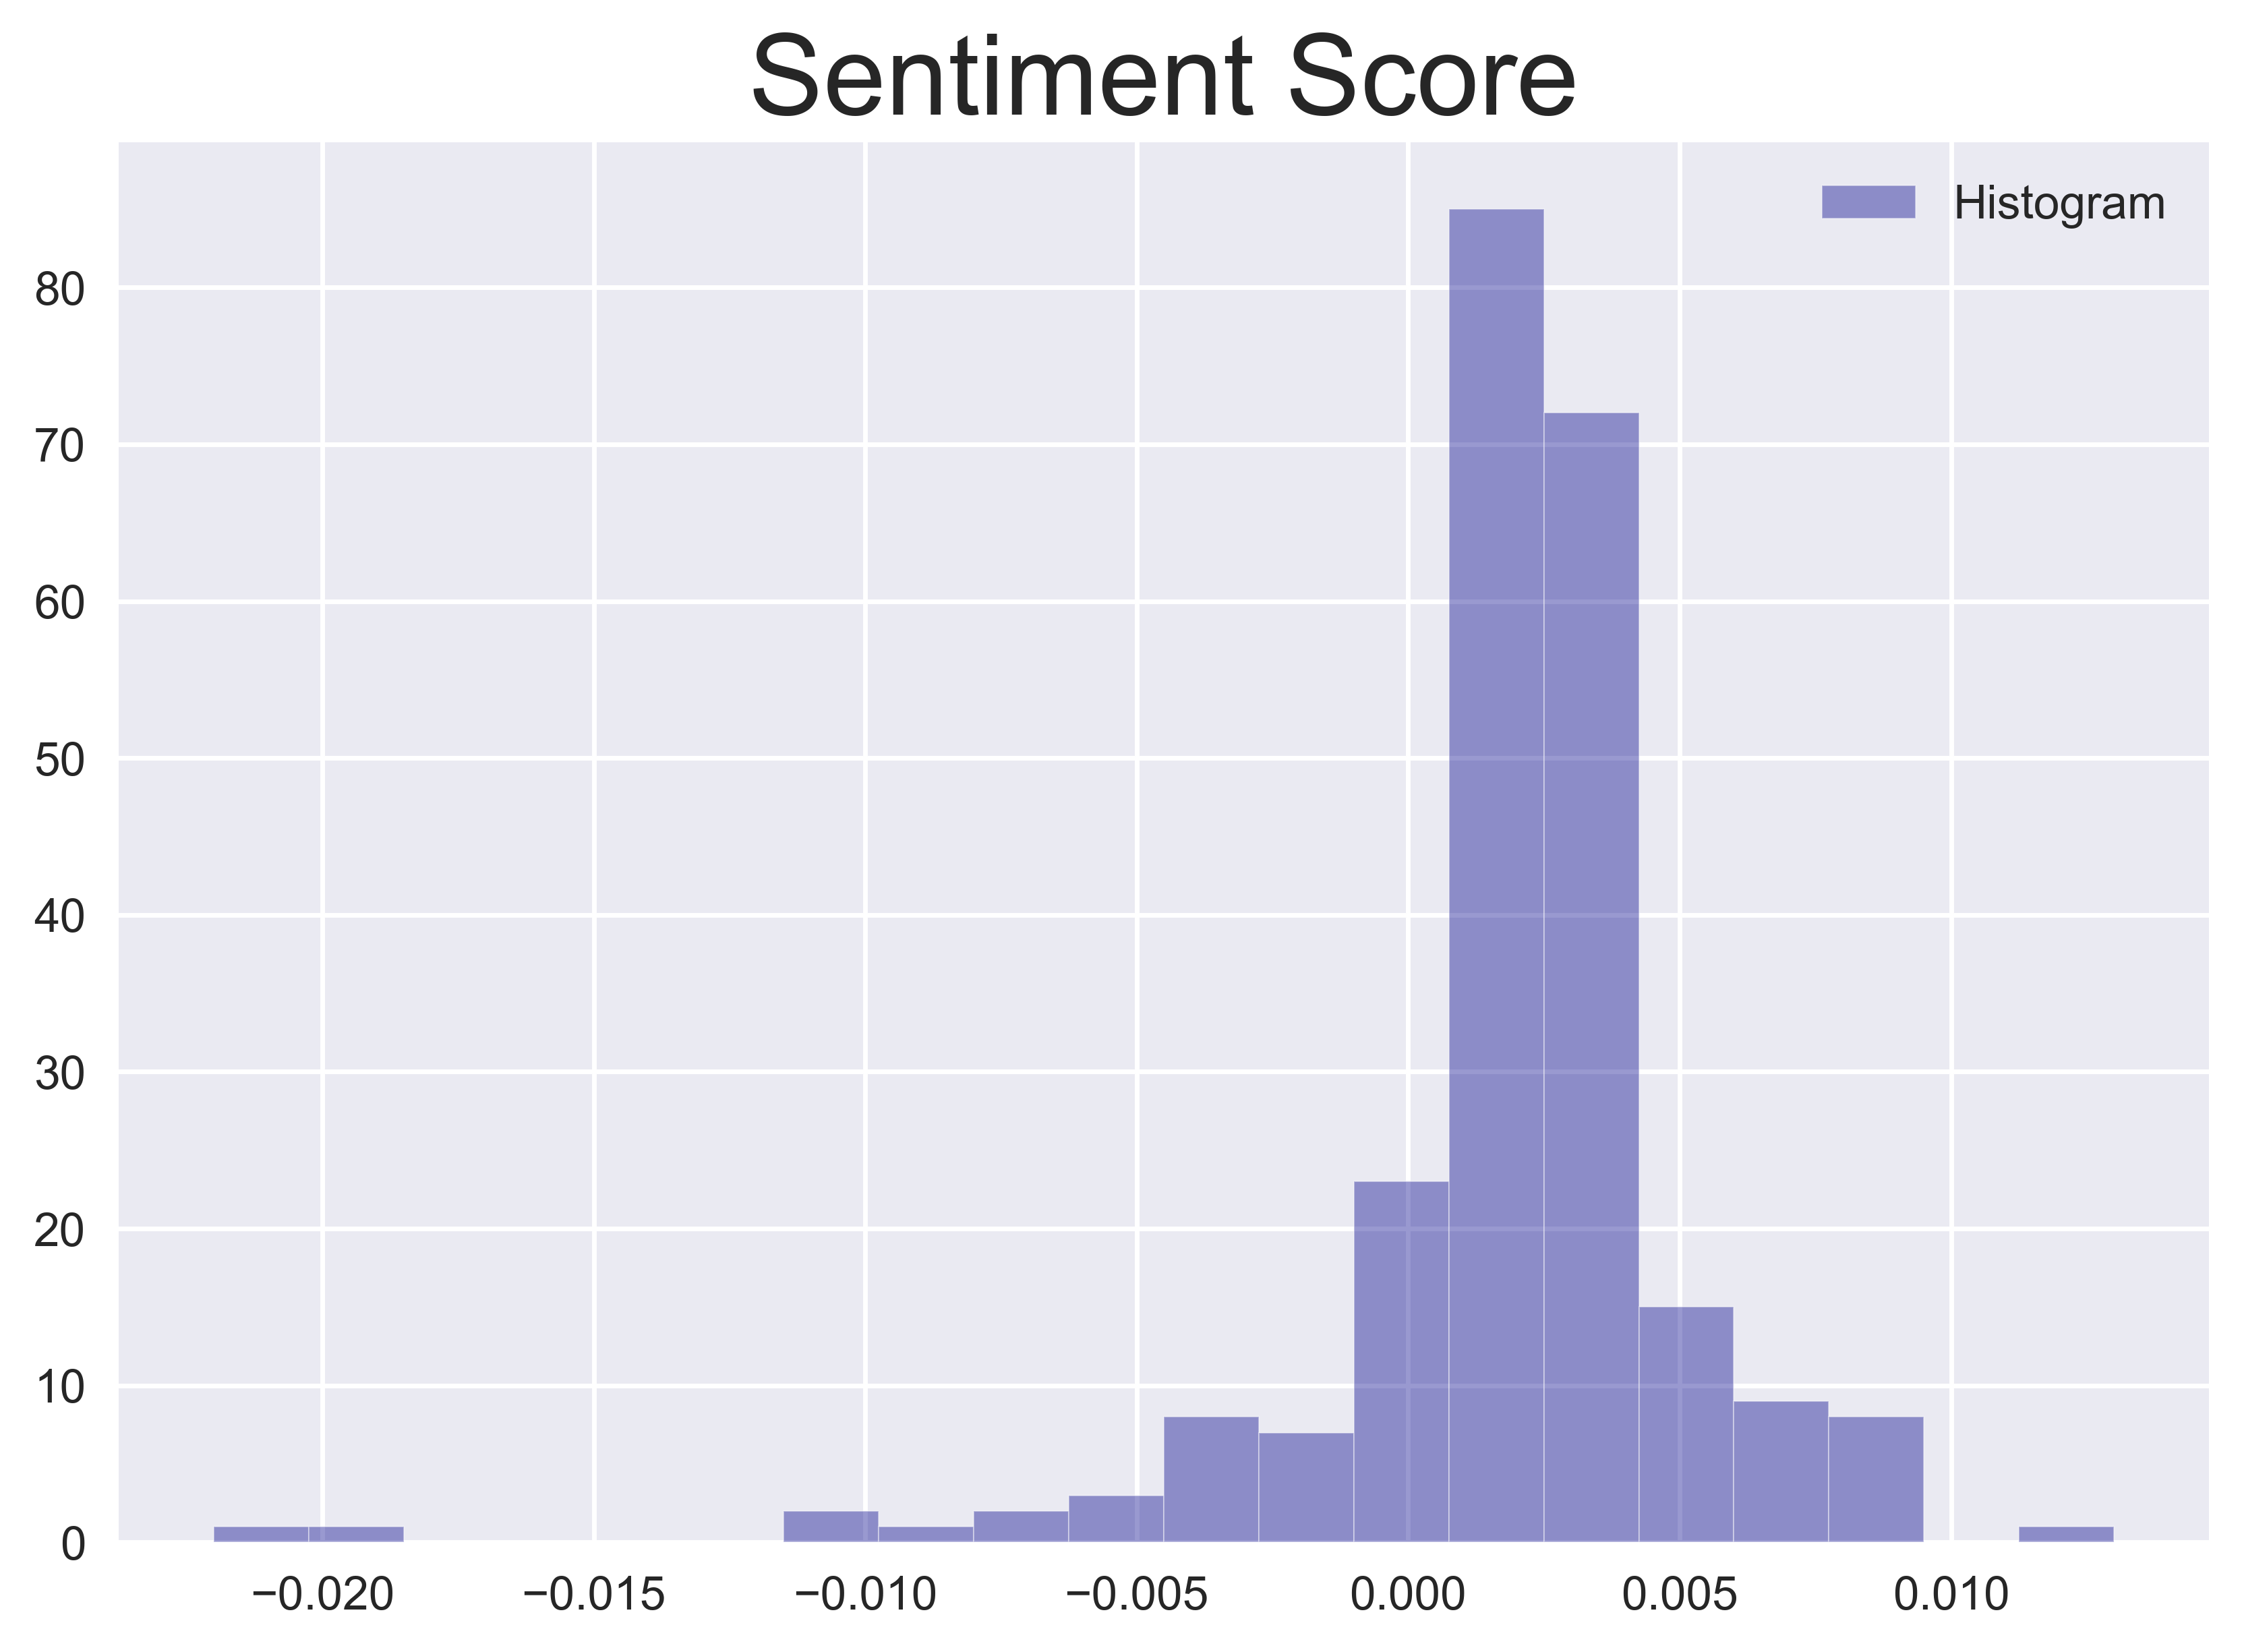
There are a number of packages for producing the sentiment score from text. Rather than locking ourselves into a specific package, let's average the scores generated by two popular sentiment analysis packages, afinn and vader. Each of these two sentiment scores are scaled to the range $[-1, 1]$, where $0$ represents a neutral sentiment, and $(0, 1]$ and $[-1, 0)$, represent a positive and negative sentiment, respectively. The final scores are normalised by the length of the tweet (word count) and averaged over tweets on the same day.
Prediction: How do the features perform?
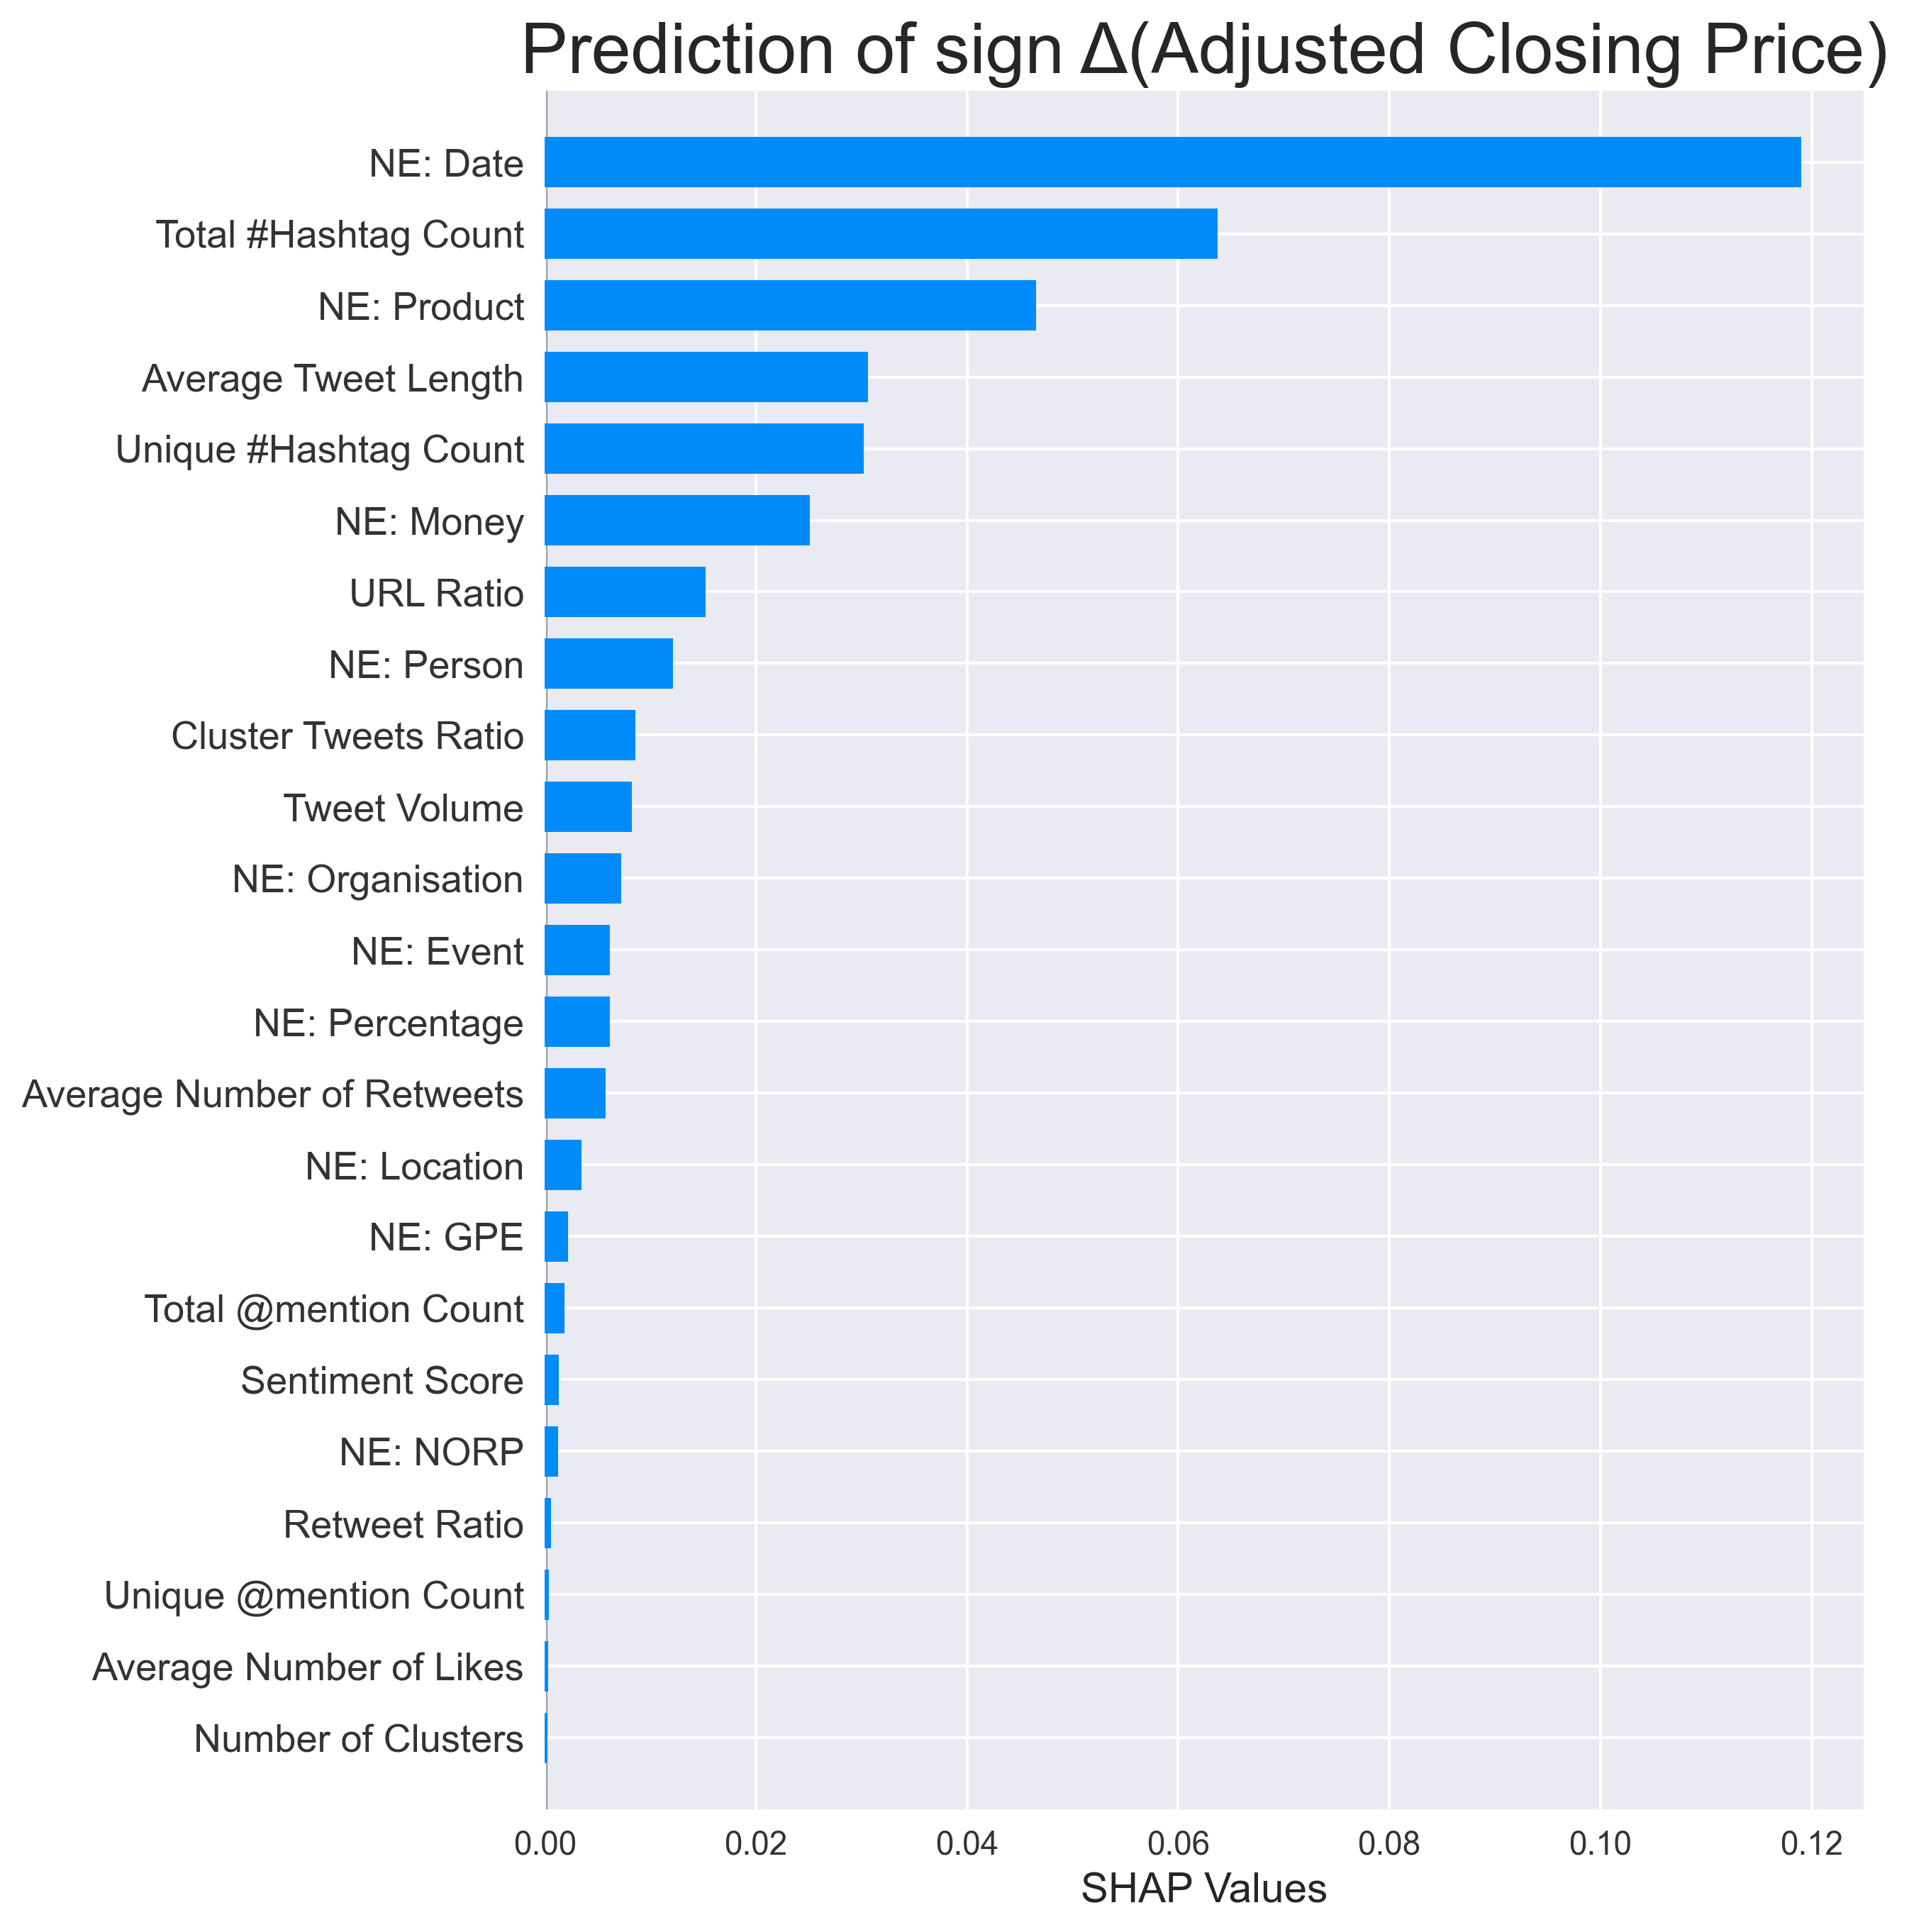
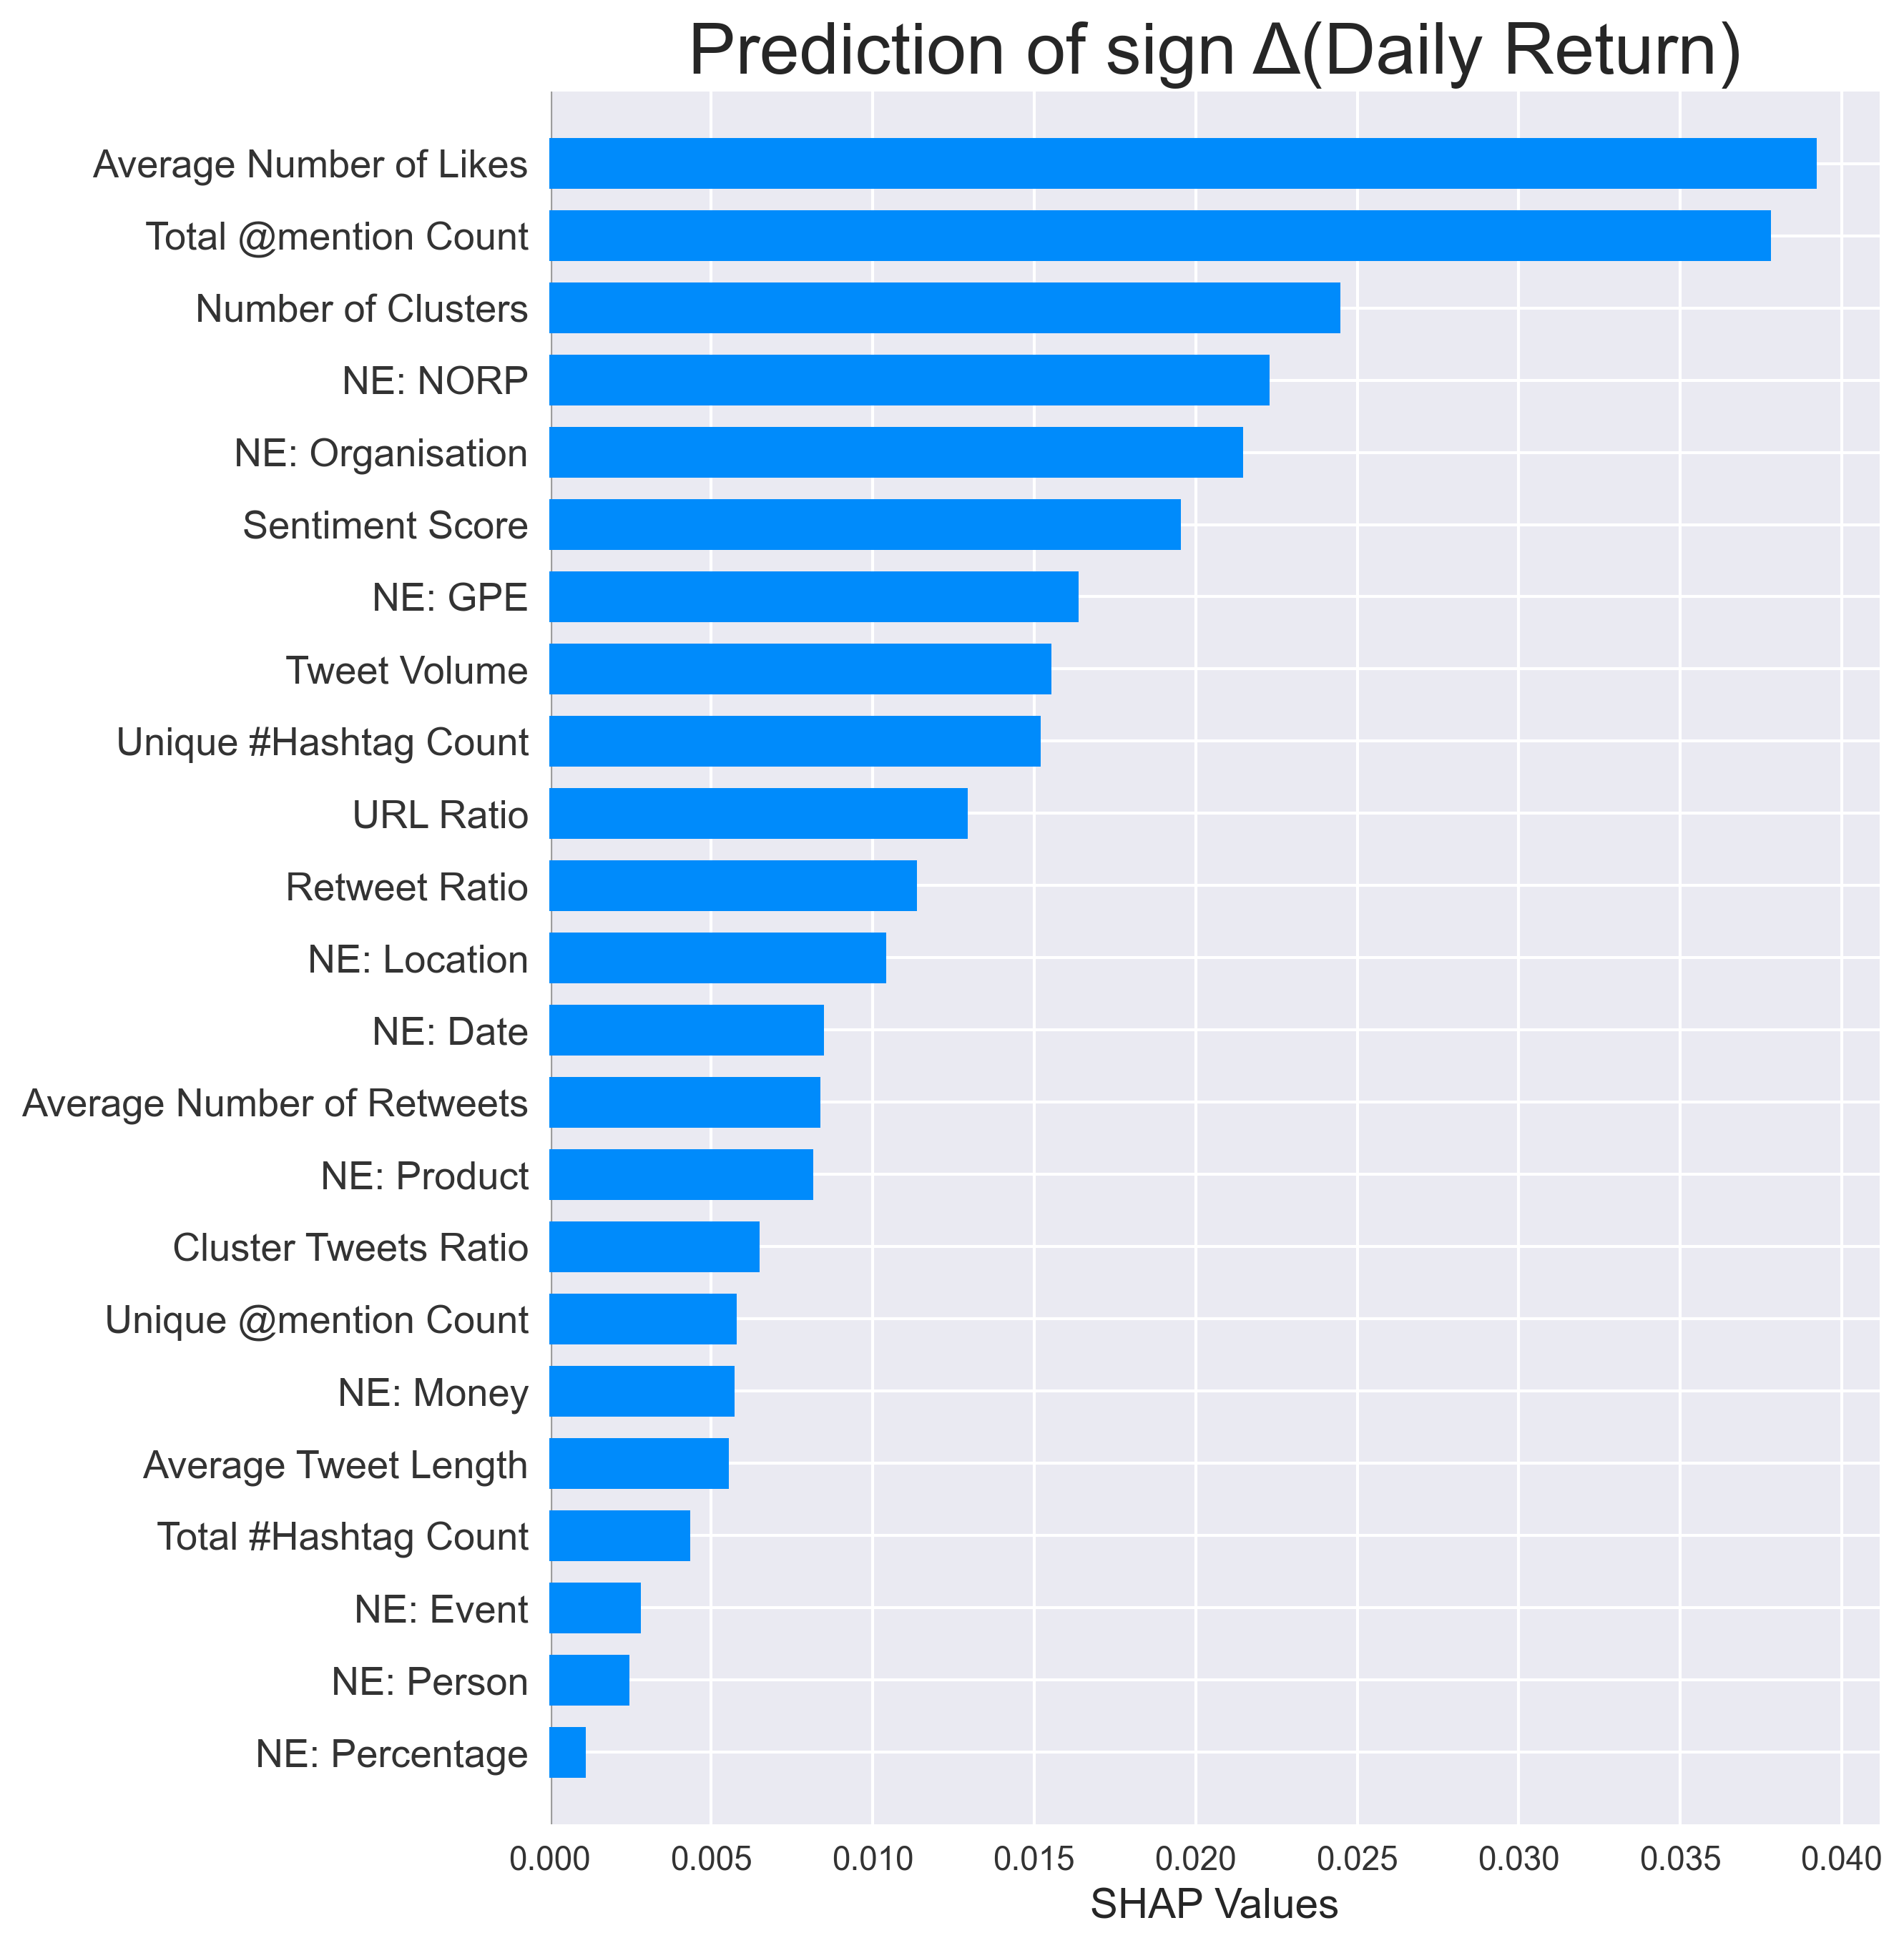
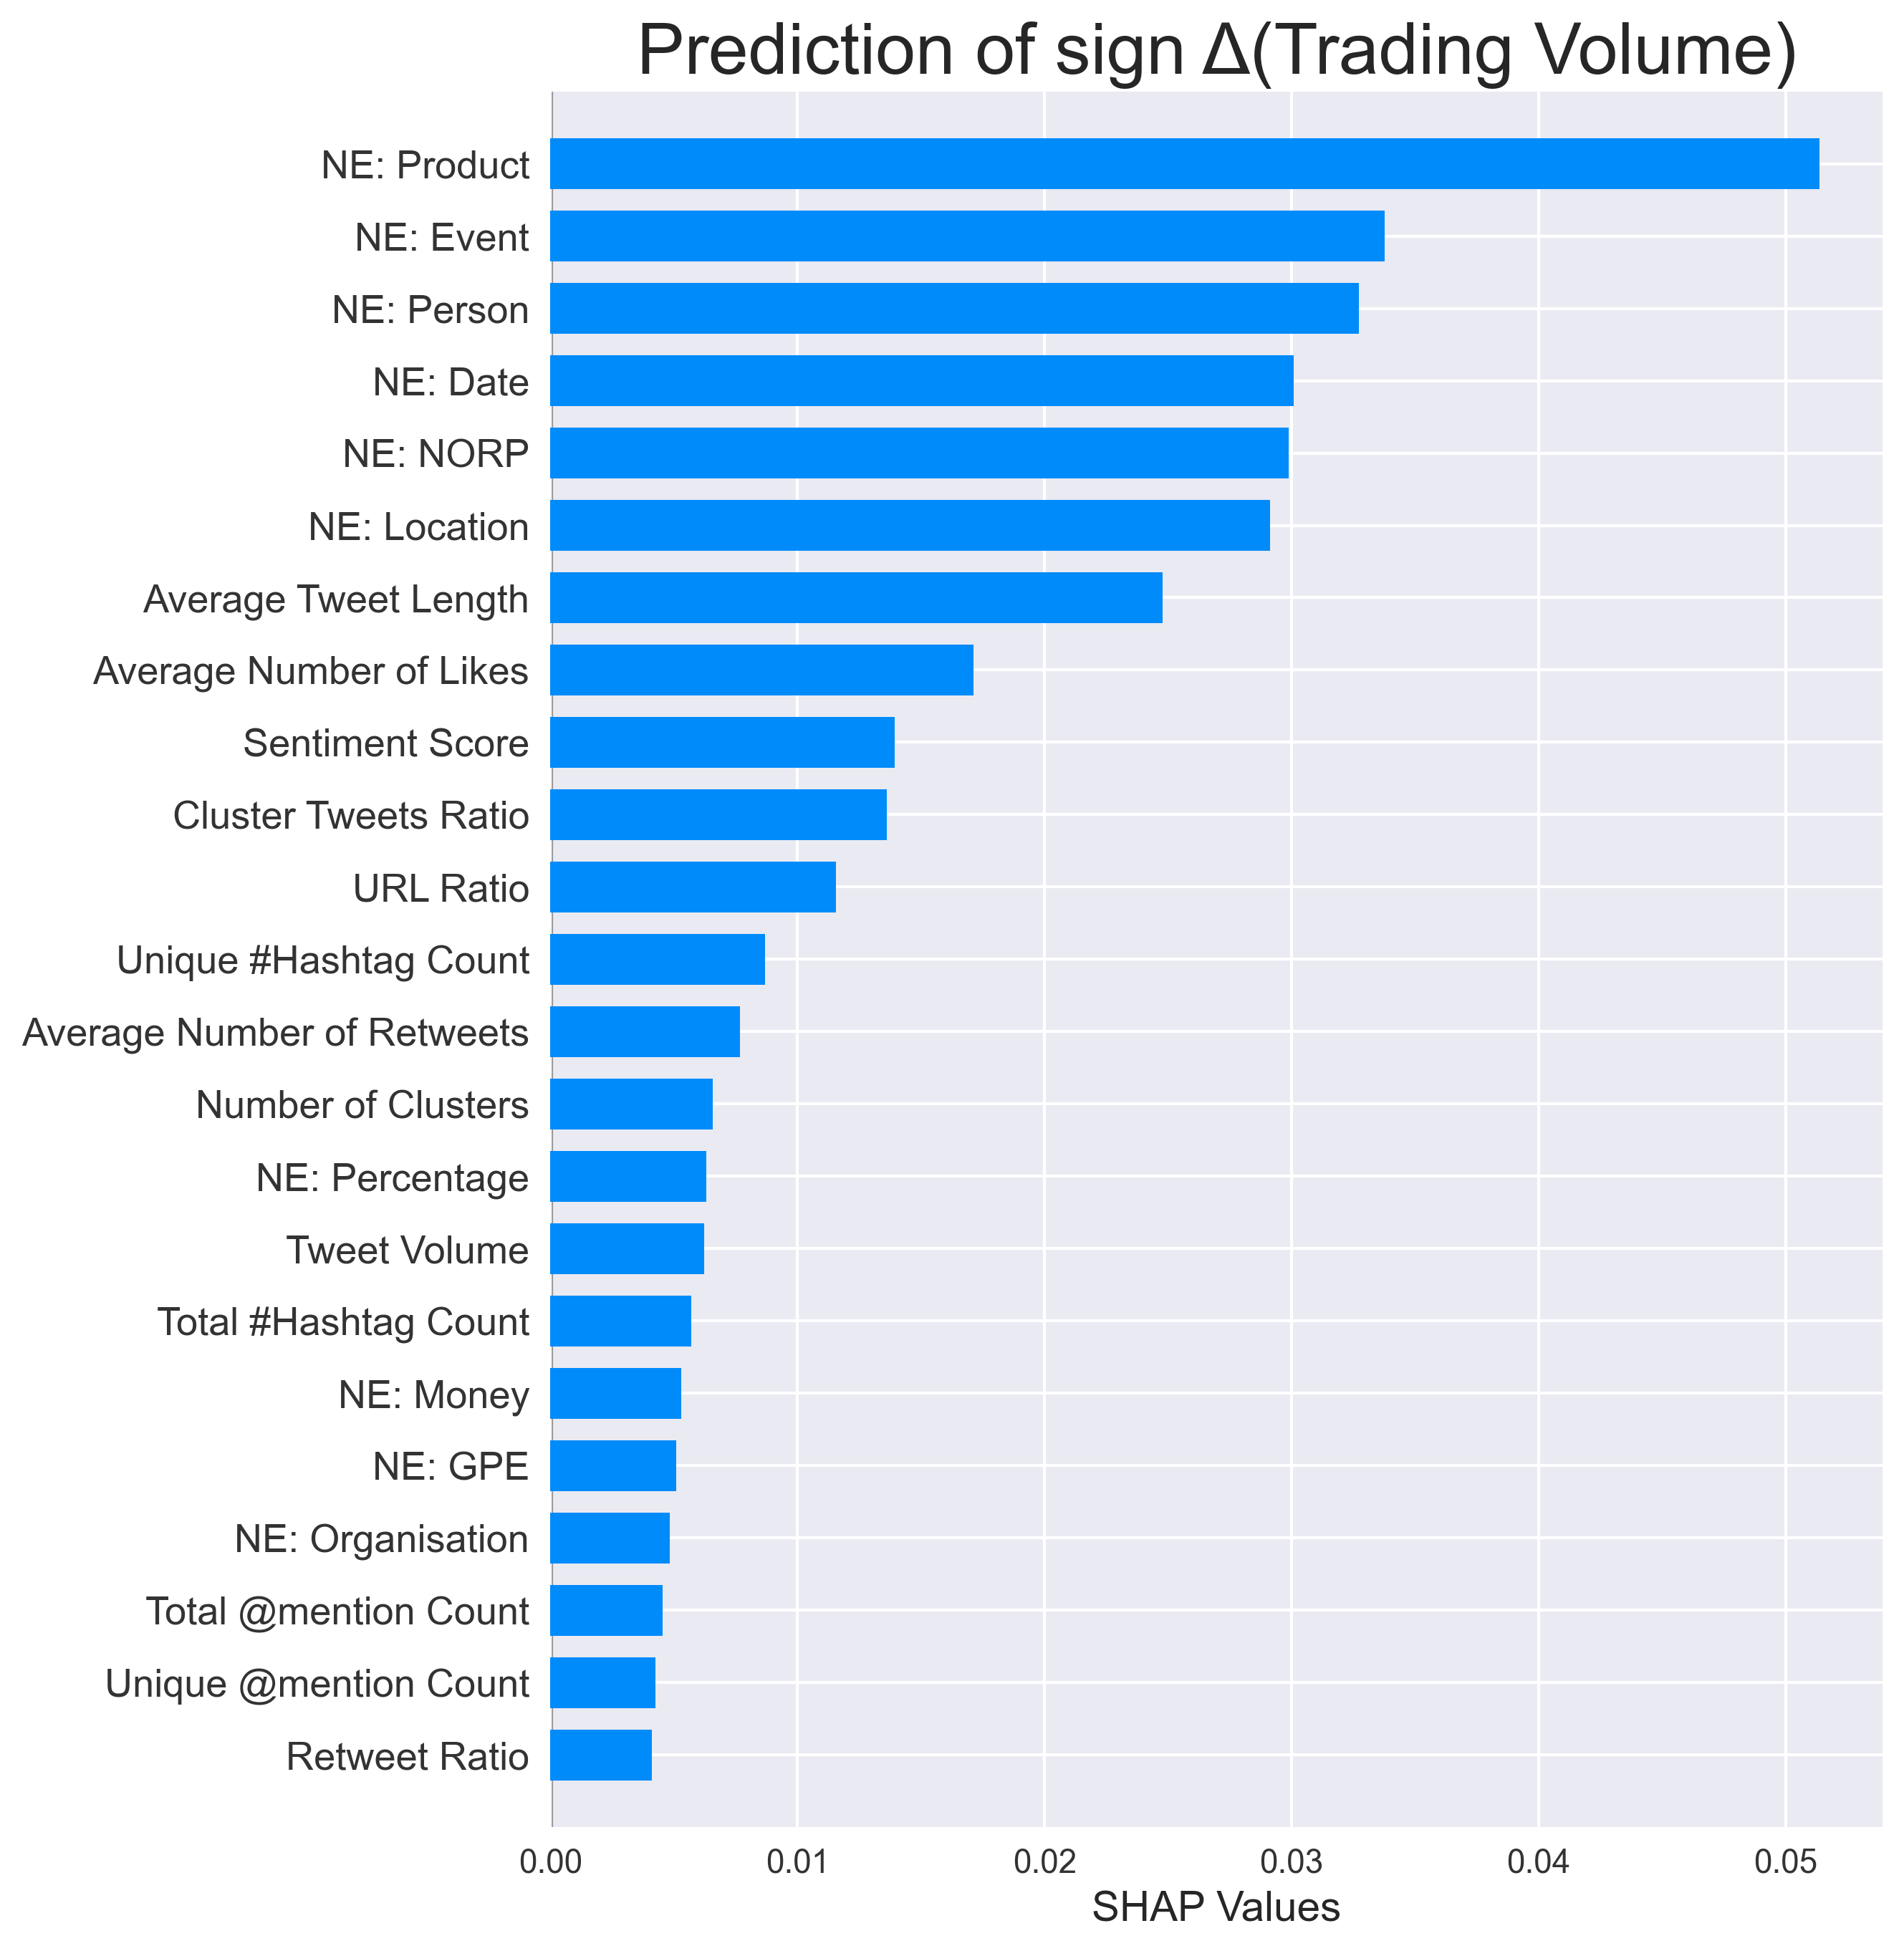
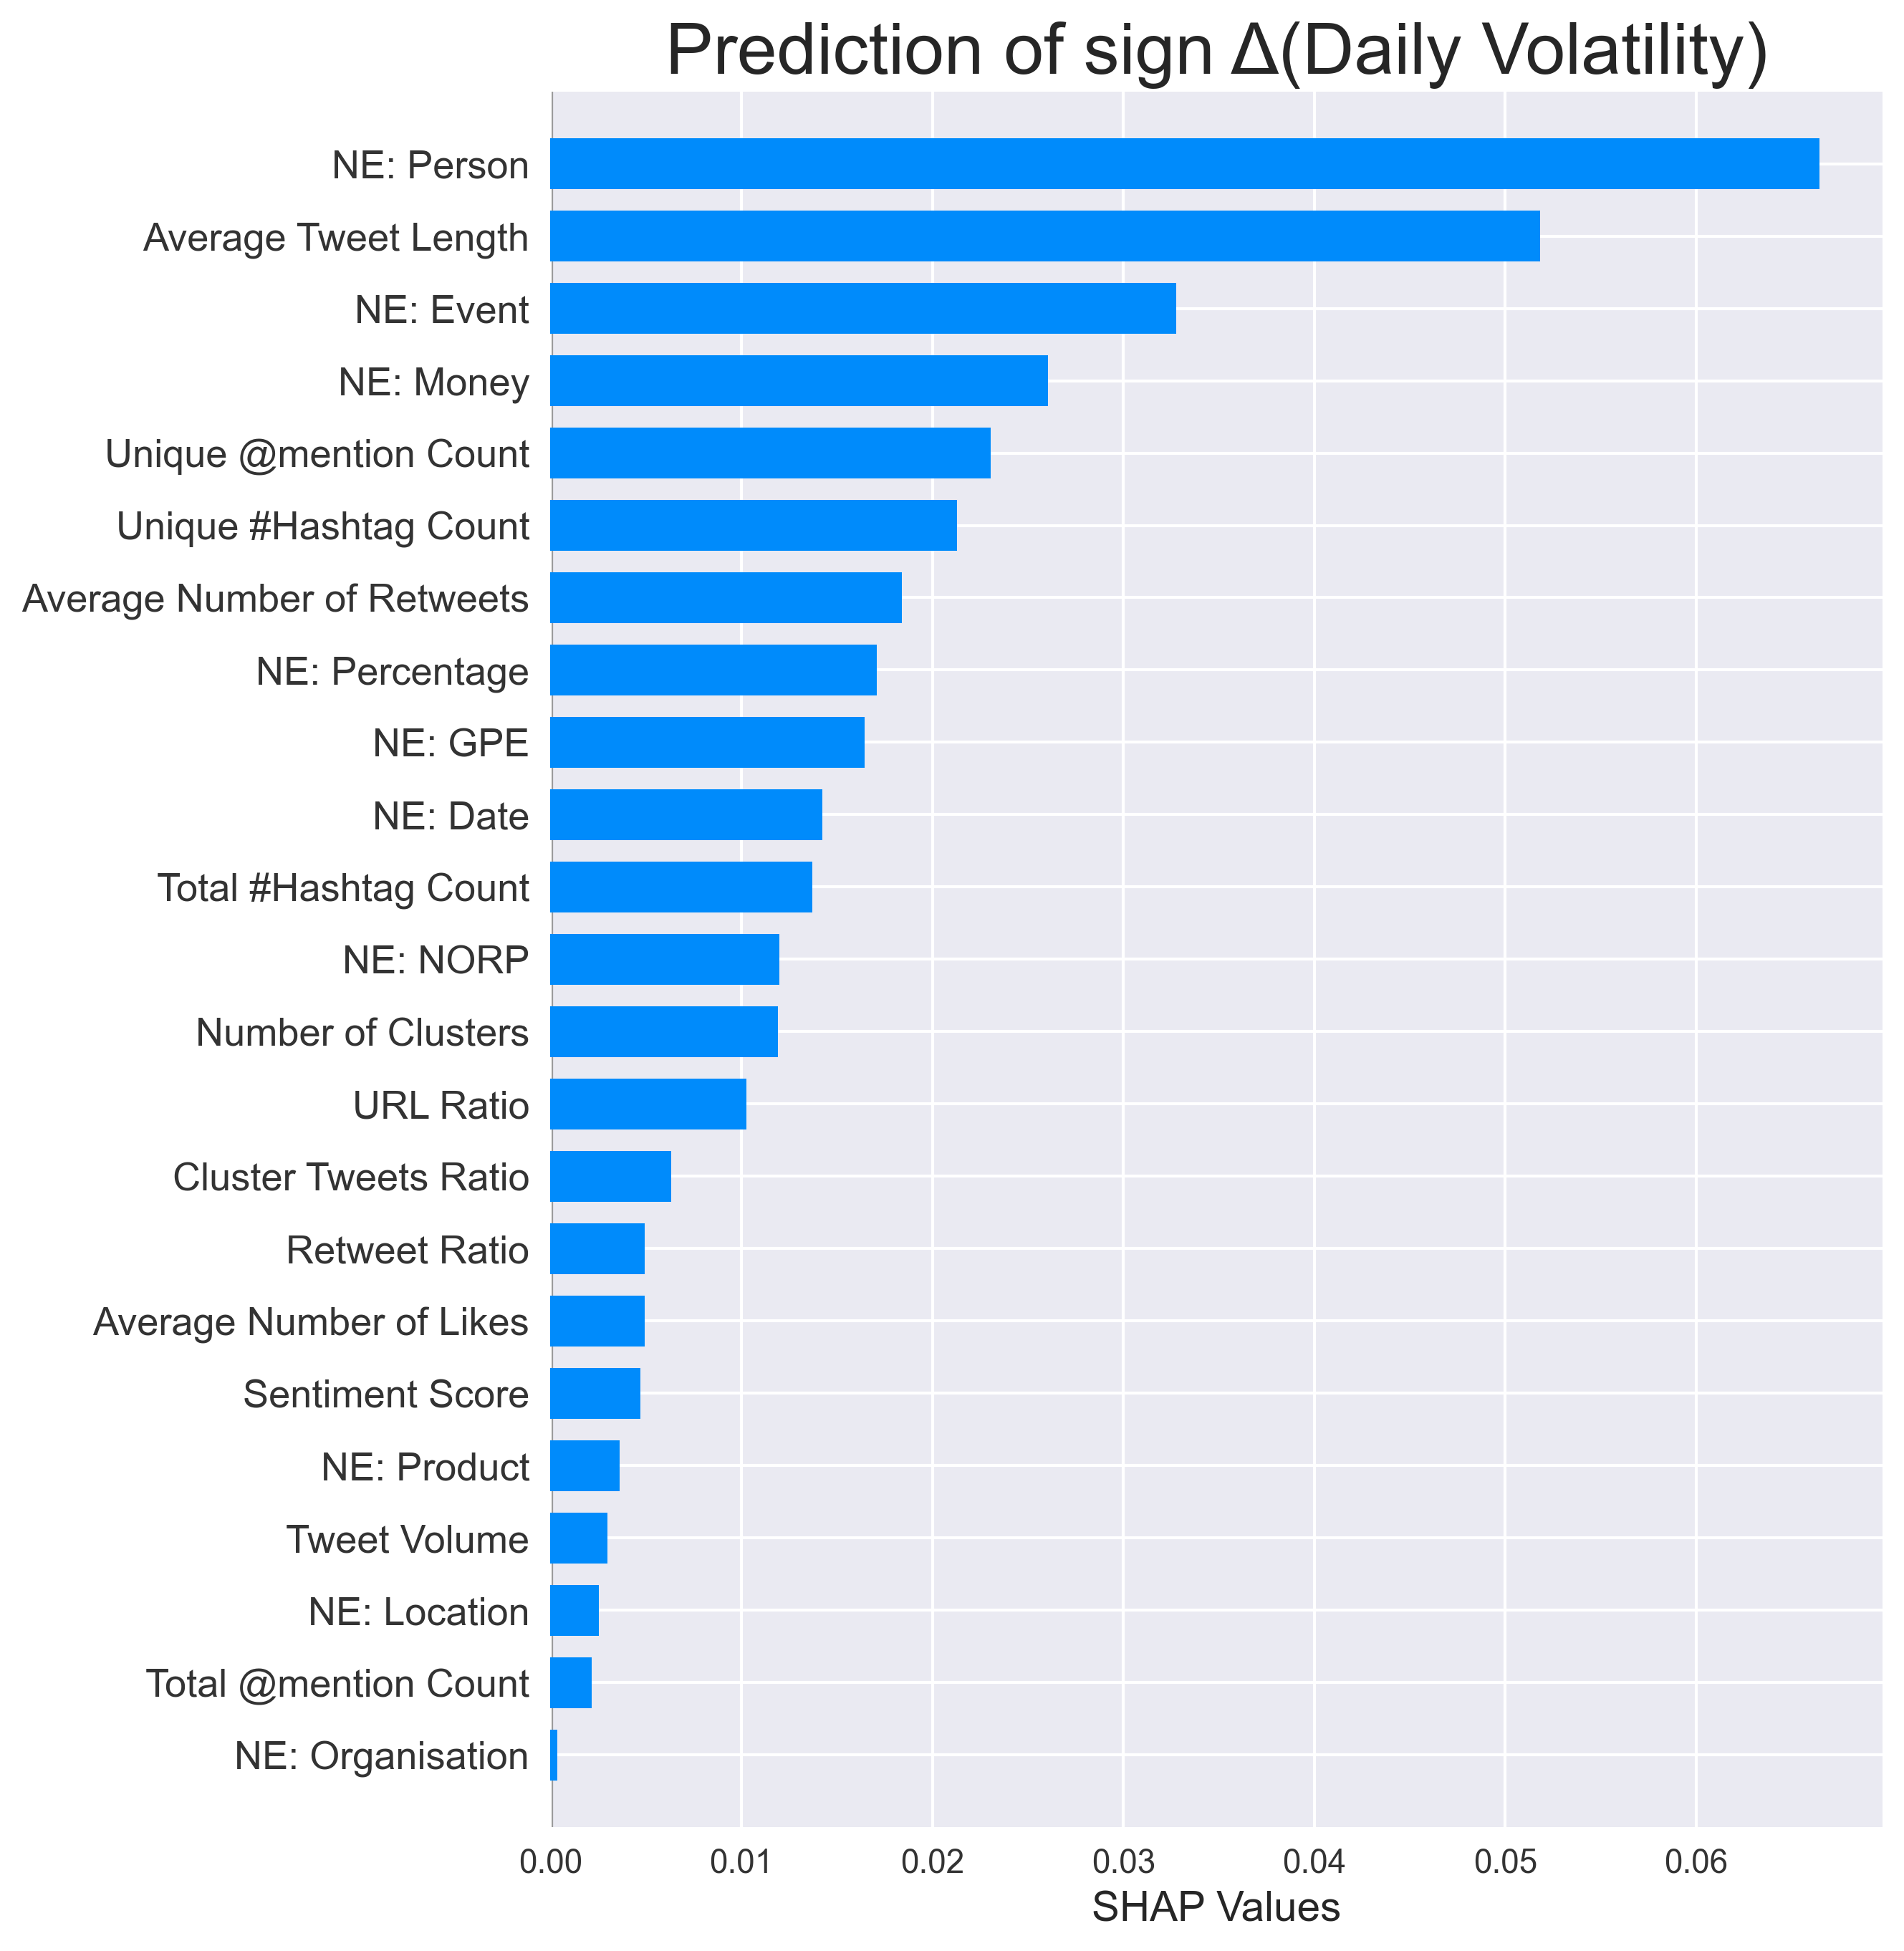
So far, I have generated 23 daily features from tweets collected for Company A, which is a 238 (days/records) x 23 (measures/features) matrix. For this study, let's define some classification target labels that I can attempt to predict with these features. I define four binary classification labels that denote whether the 1) adjusted closing price, 2) daily return, 3) trading volume and 4) daily volatility of a stock will increase by some threshold over the next day. Mathematically, this can be denoted as sign $\Delta Z$. With these four targets, I experiment with a simple binary classification model.
For all available dates in the data set (26th November 2019 to 20th July 2020), I calculate the rolling mean of features from date $t$ to $t-n$ to smooth noisy fluctuations, where the number of days $n$ is a hyperparameter. This feature set ($X$) is paired with each of the four target labels for the next day $t+1$ ($y$) as the dataset for classification experiments. The first seven months of the dataset (Nov 2019 - May 2020) are used for training, and the remaining two months (Jun and Jul 2020) are used for testing and evaluating the effectiveness of the features. I choose a simple logistic regression model (from the machine learning package scikit-learn) for this task in order to make the performance rely more on the features than the learning model.
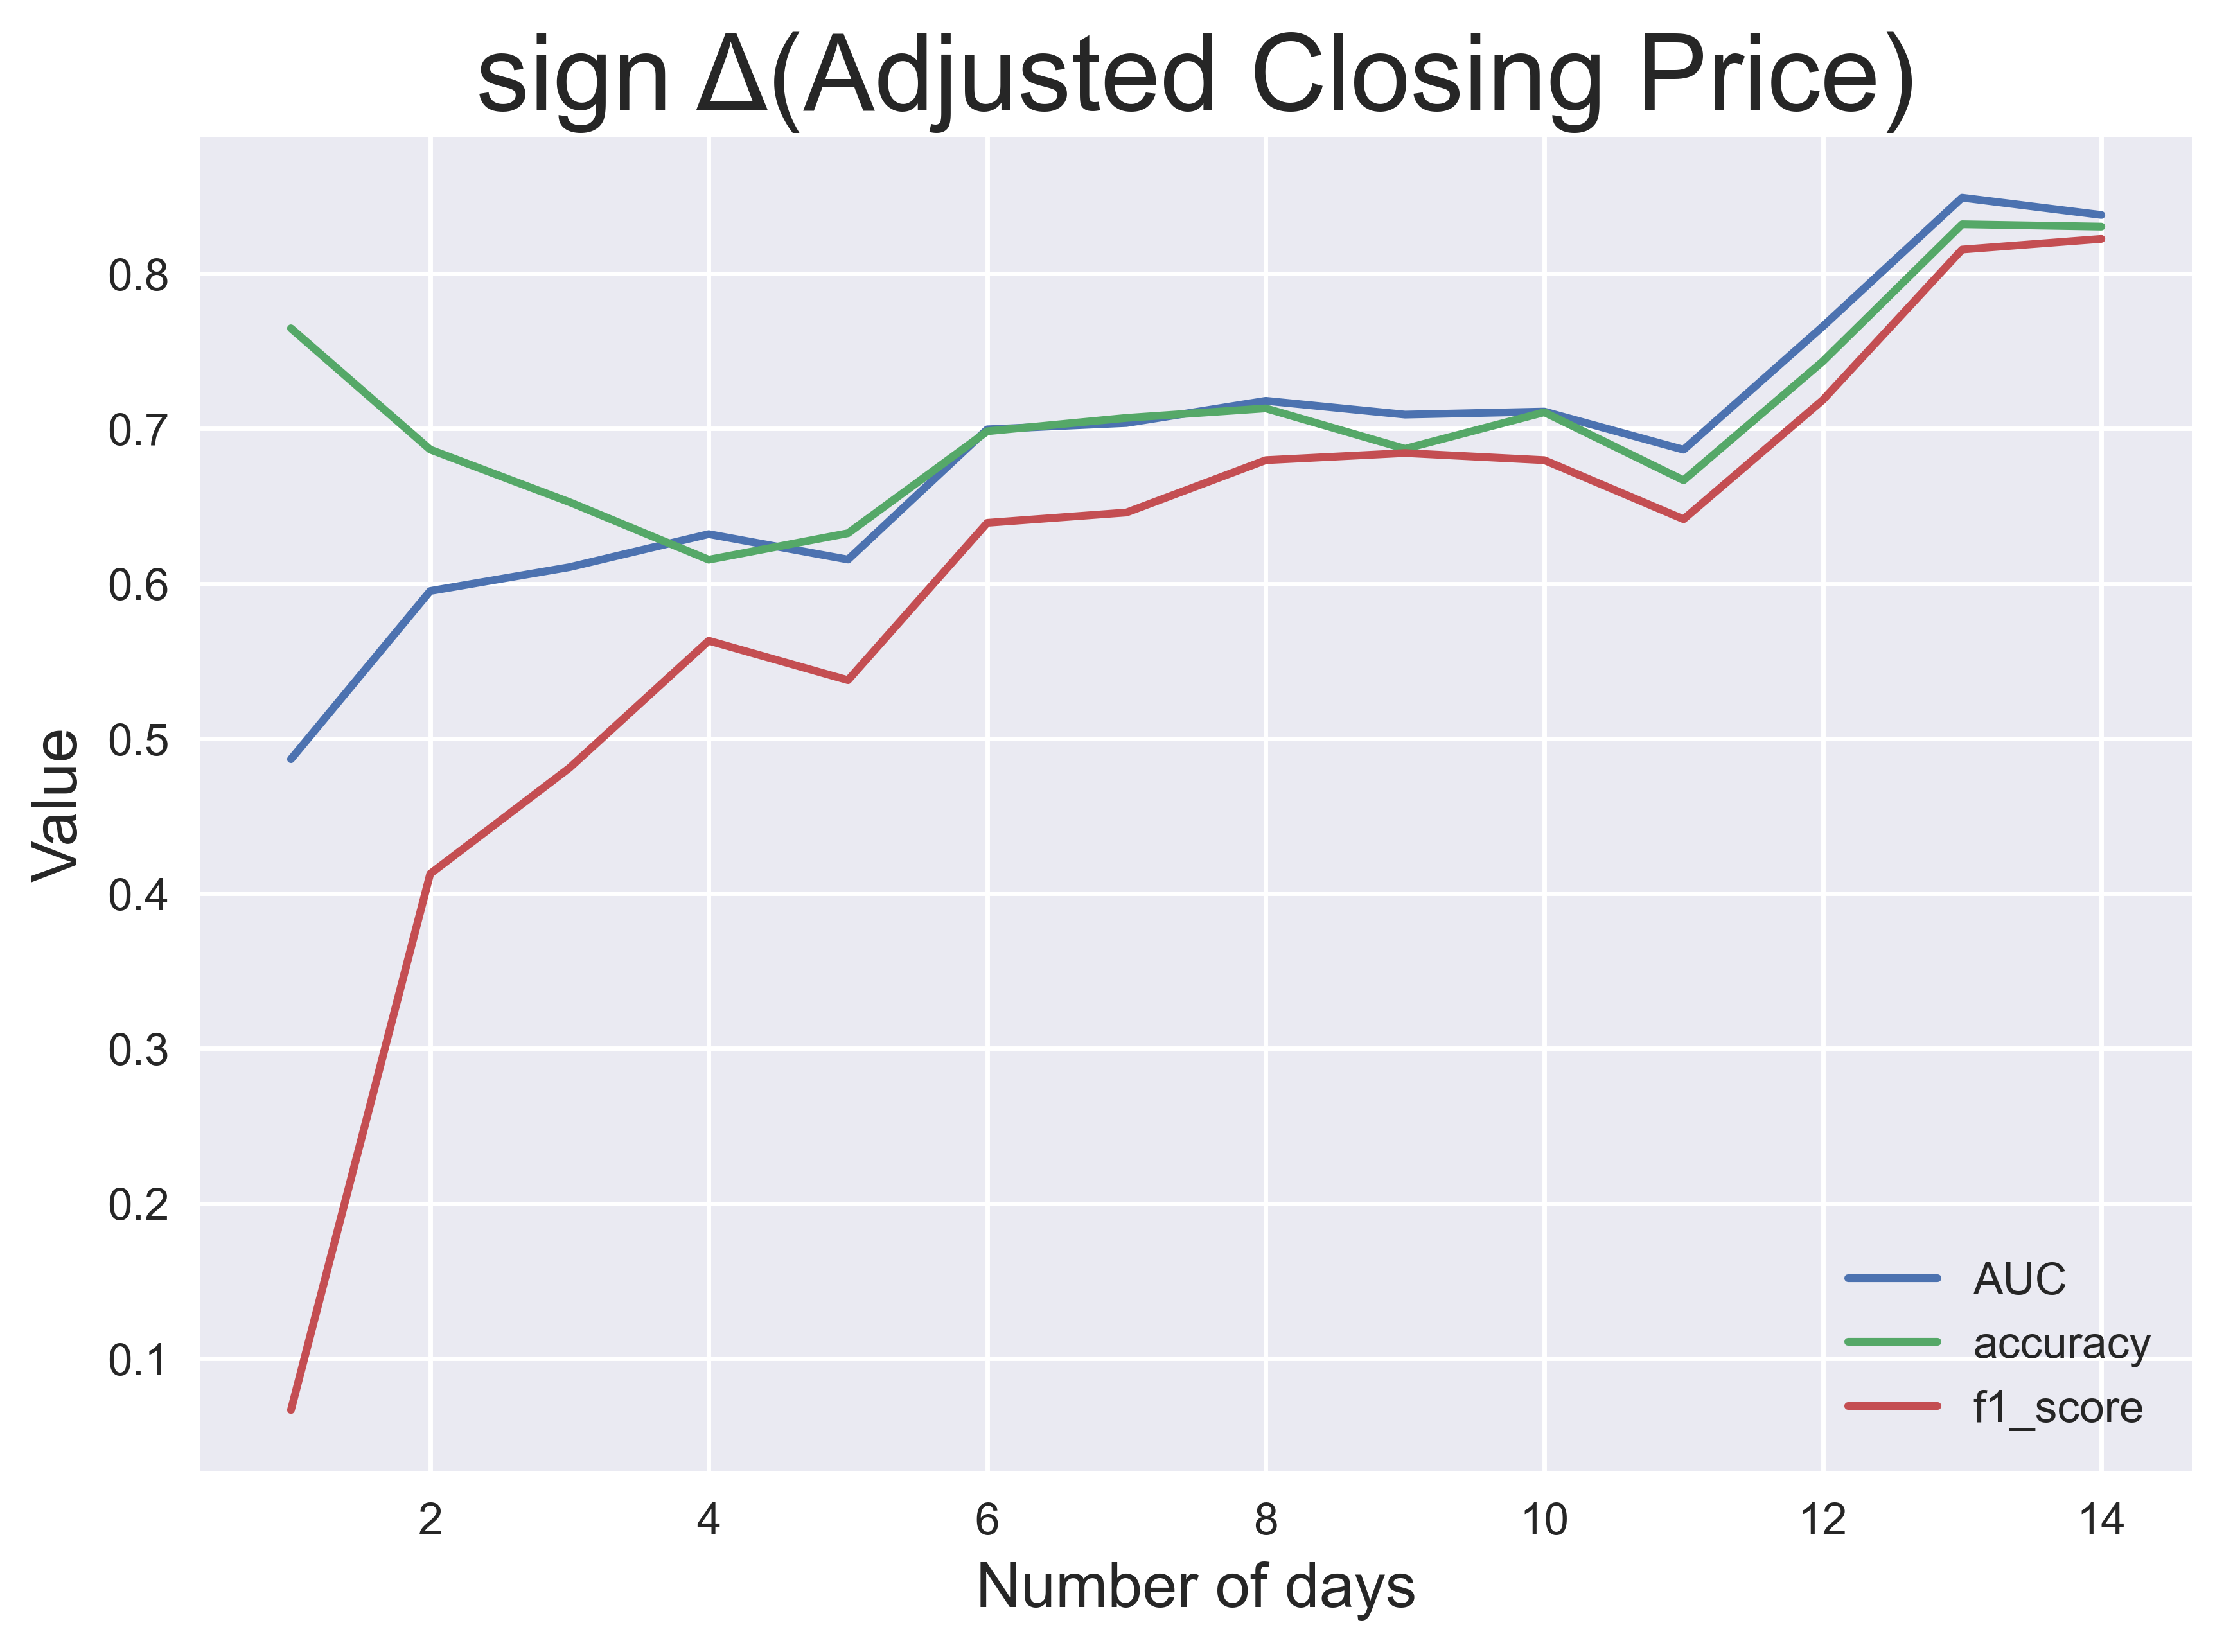
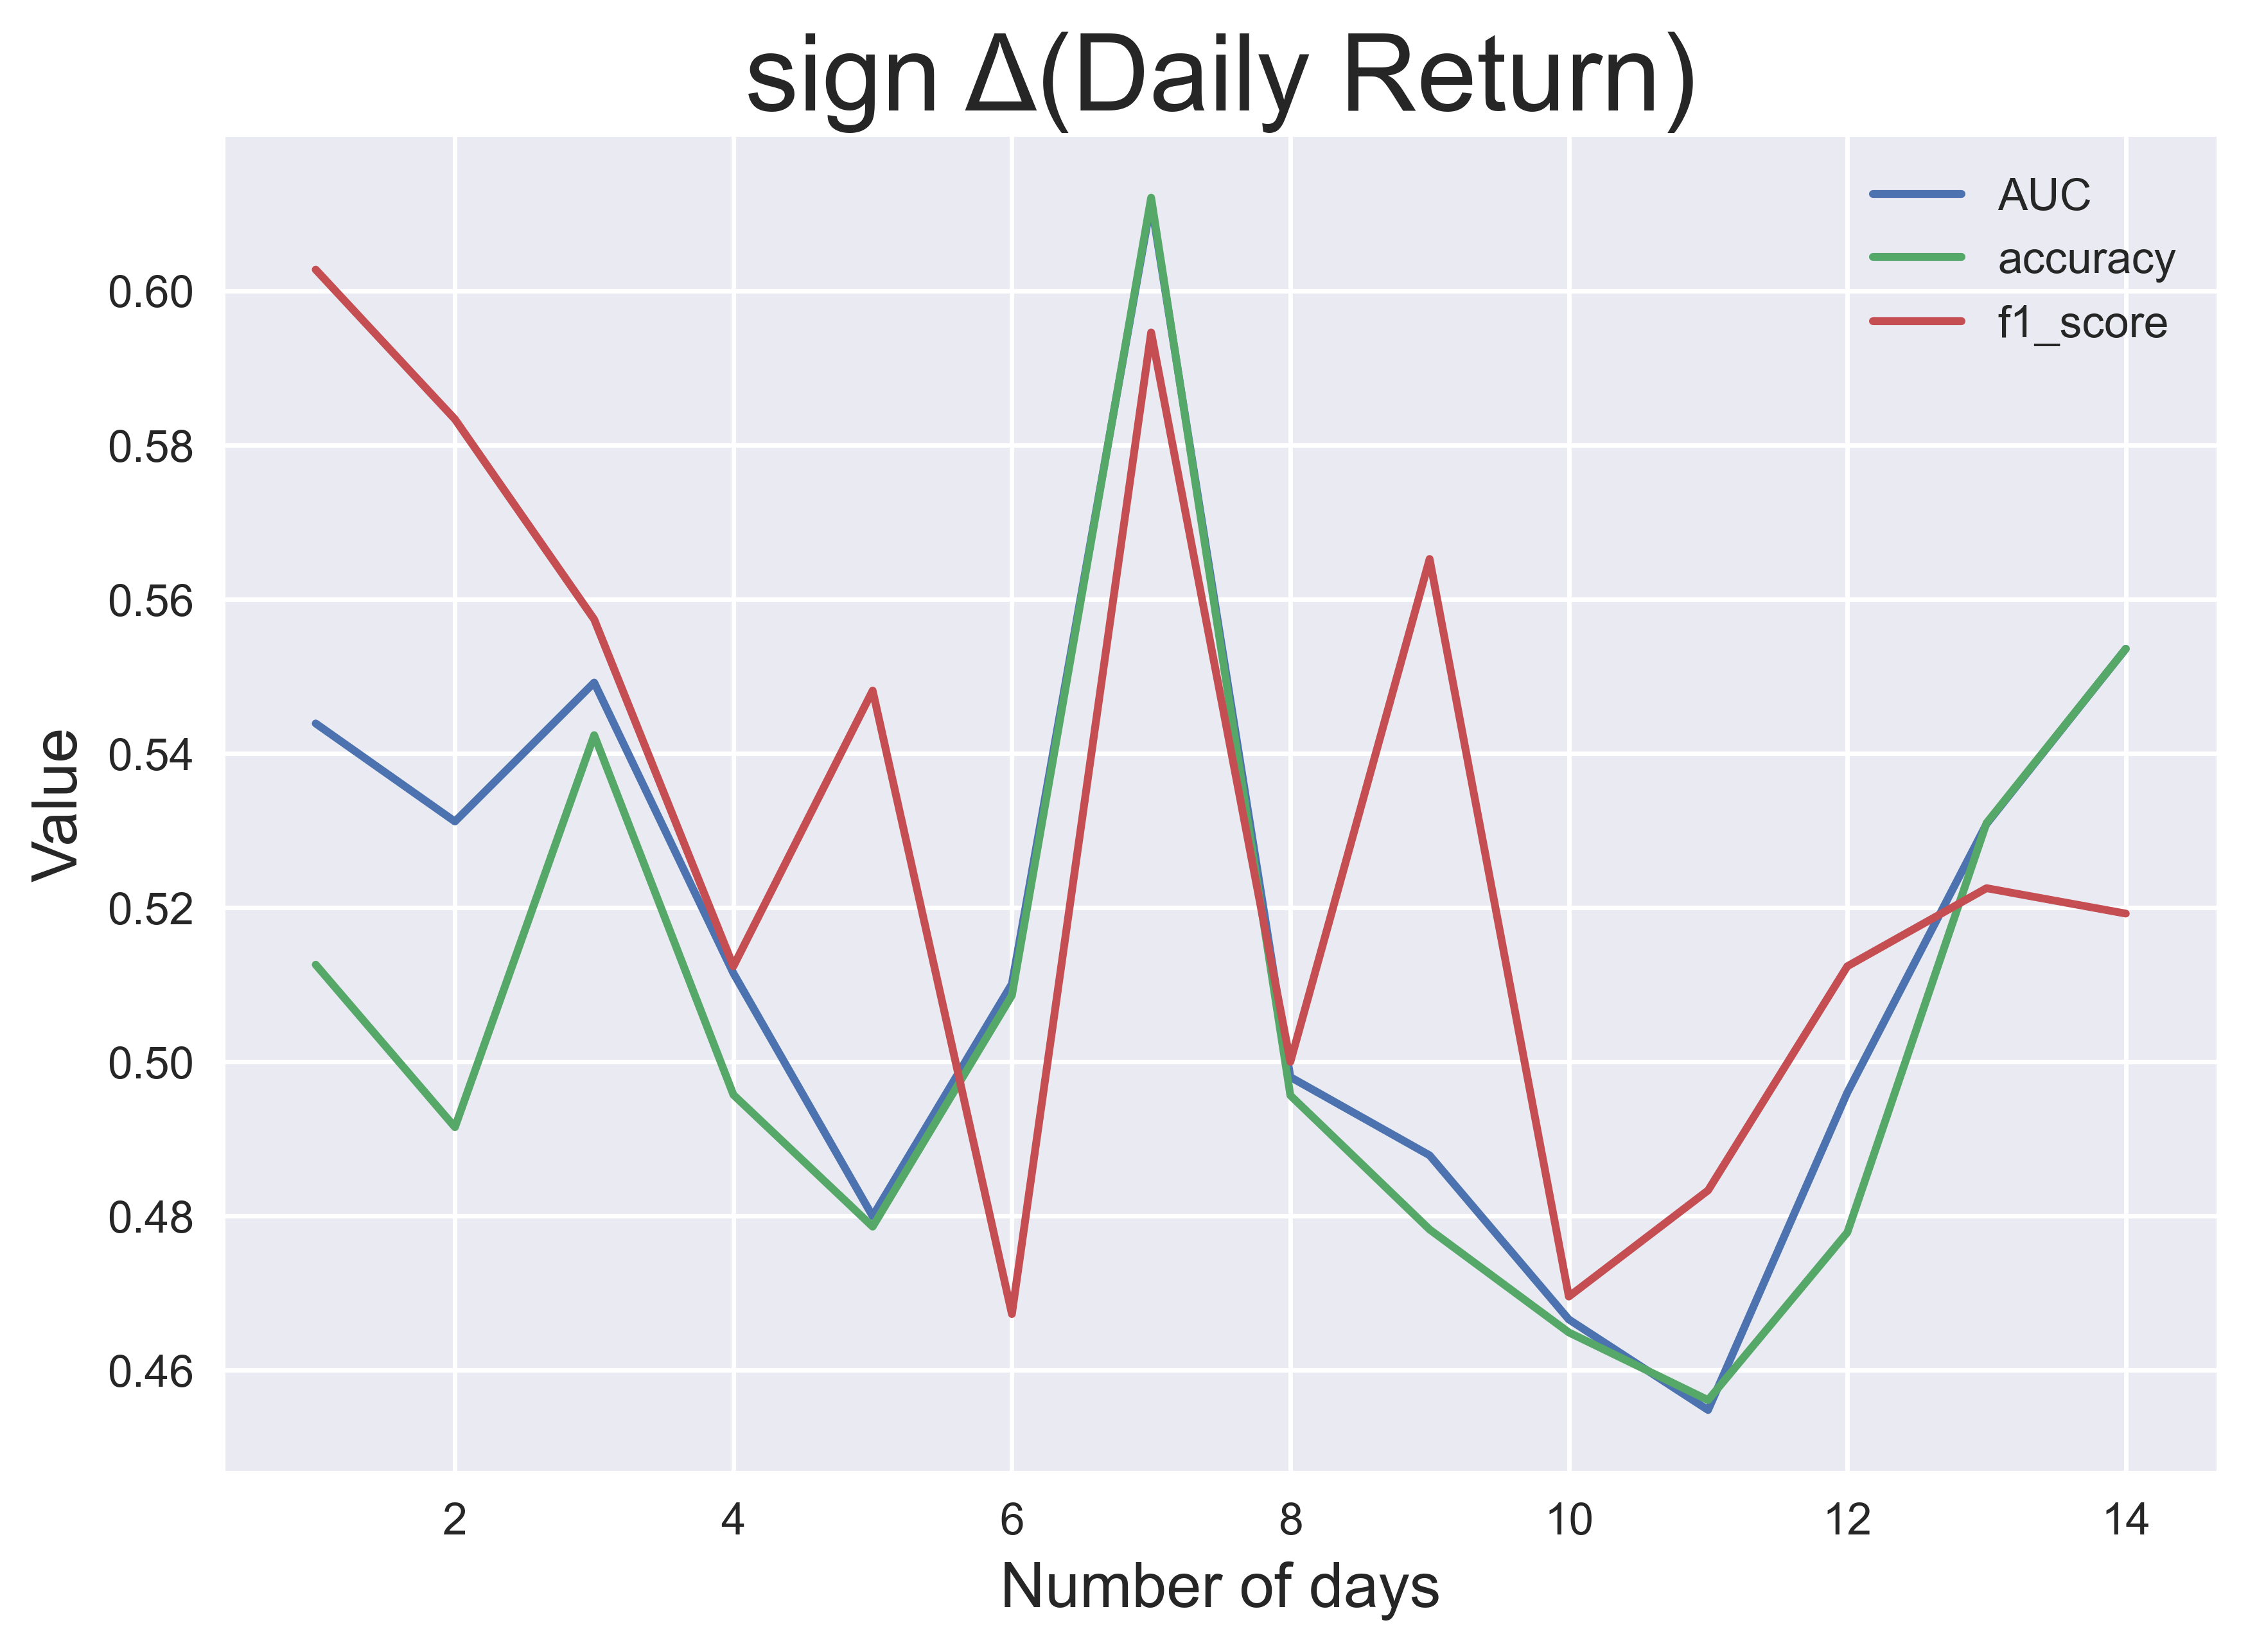
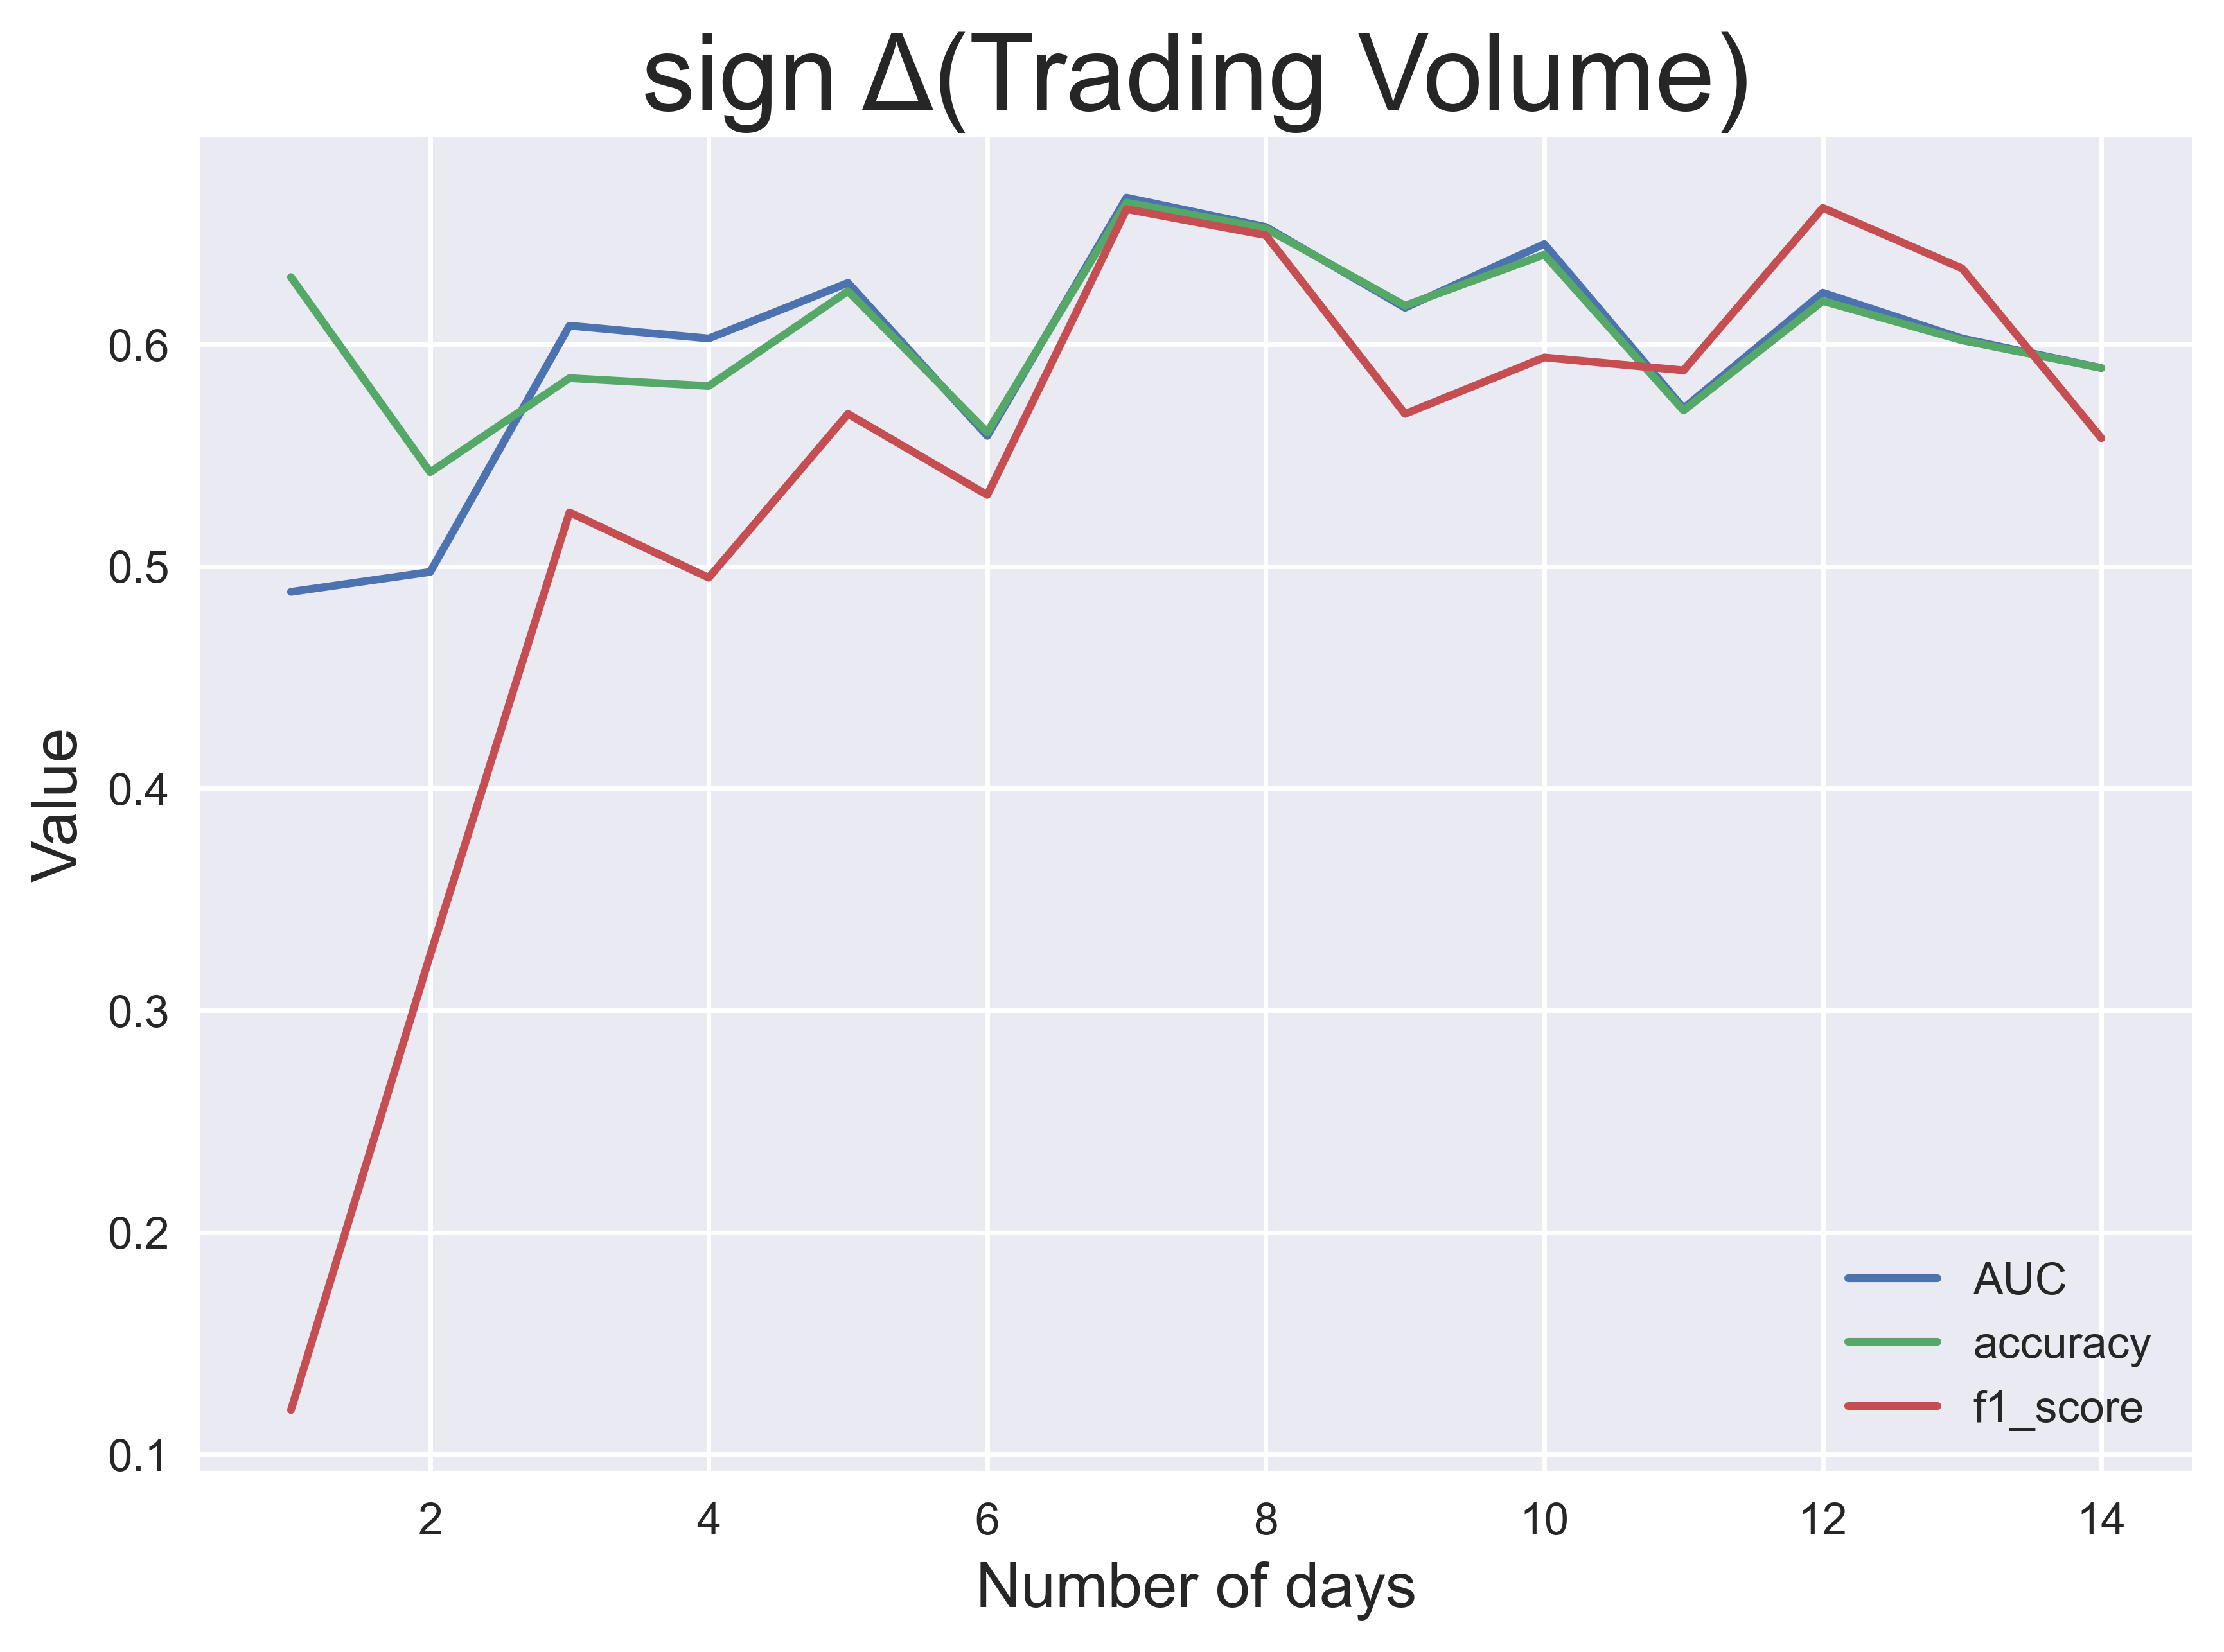
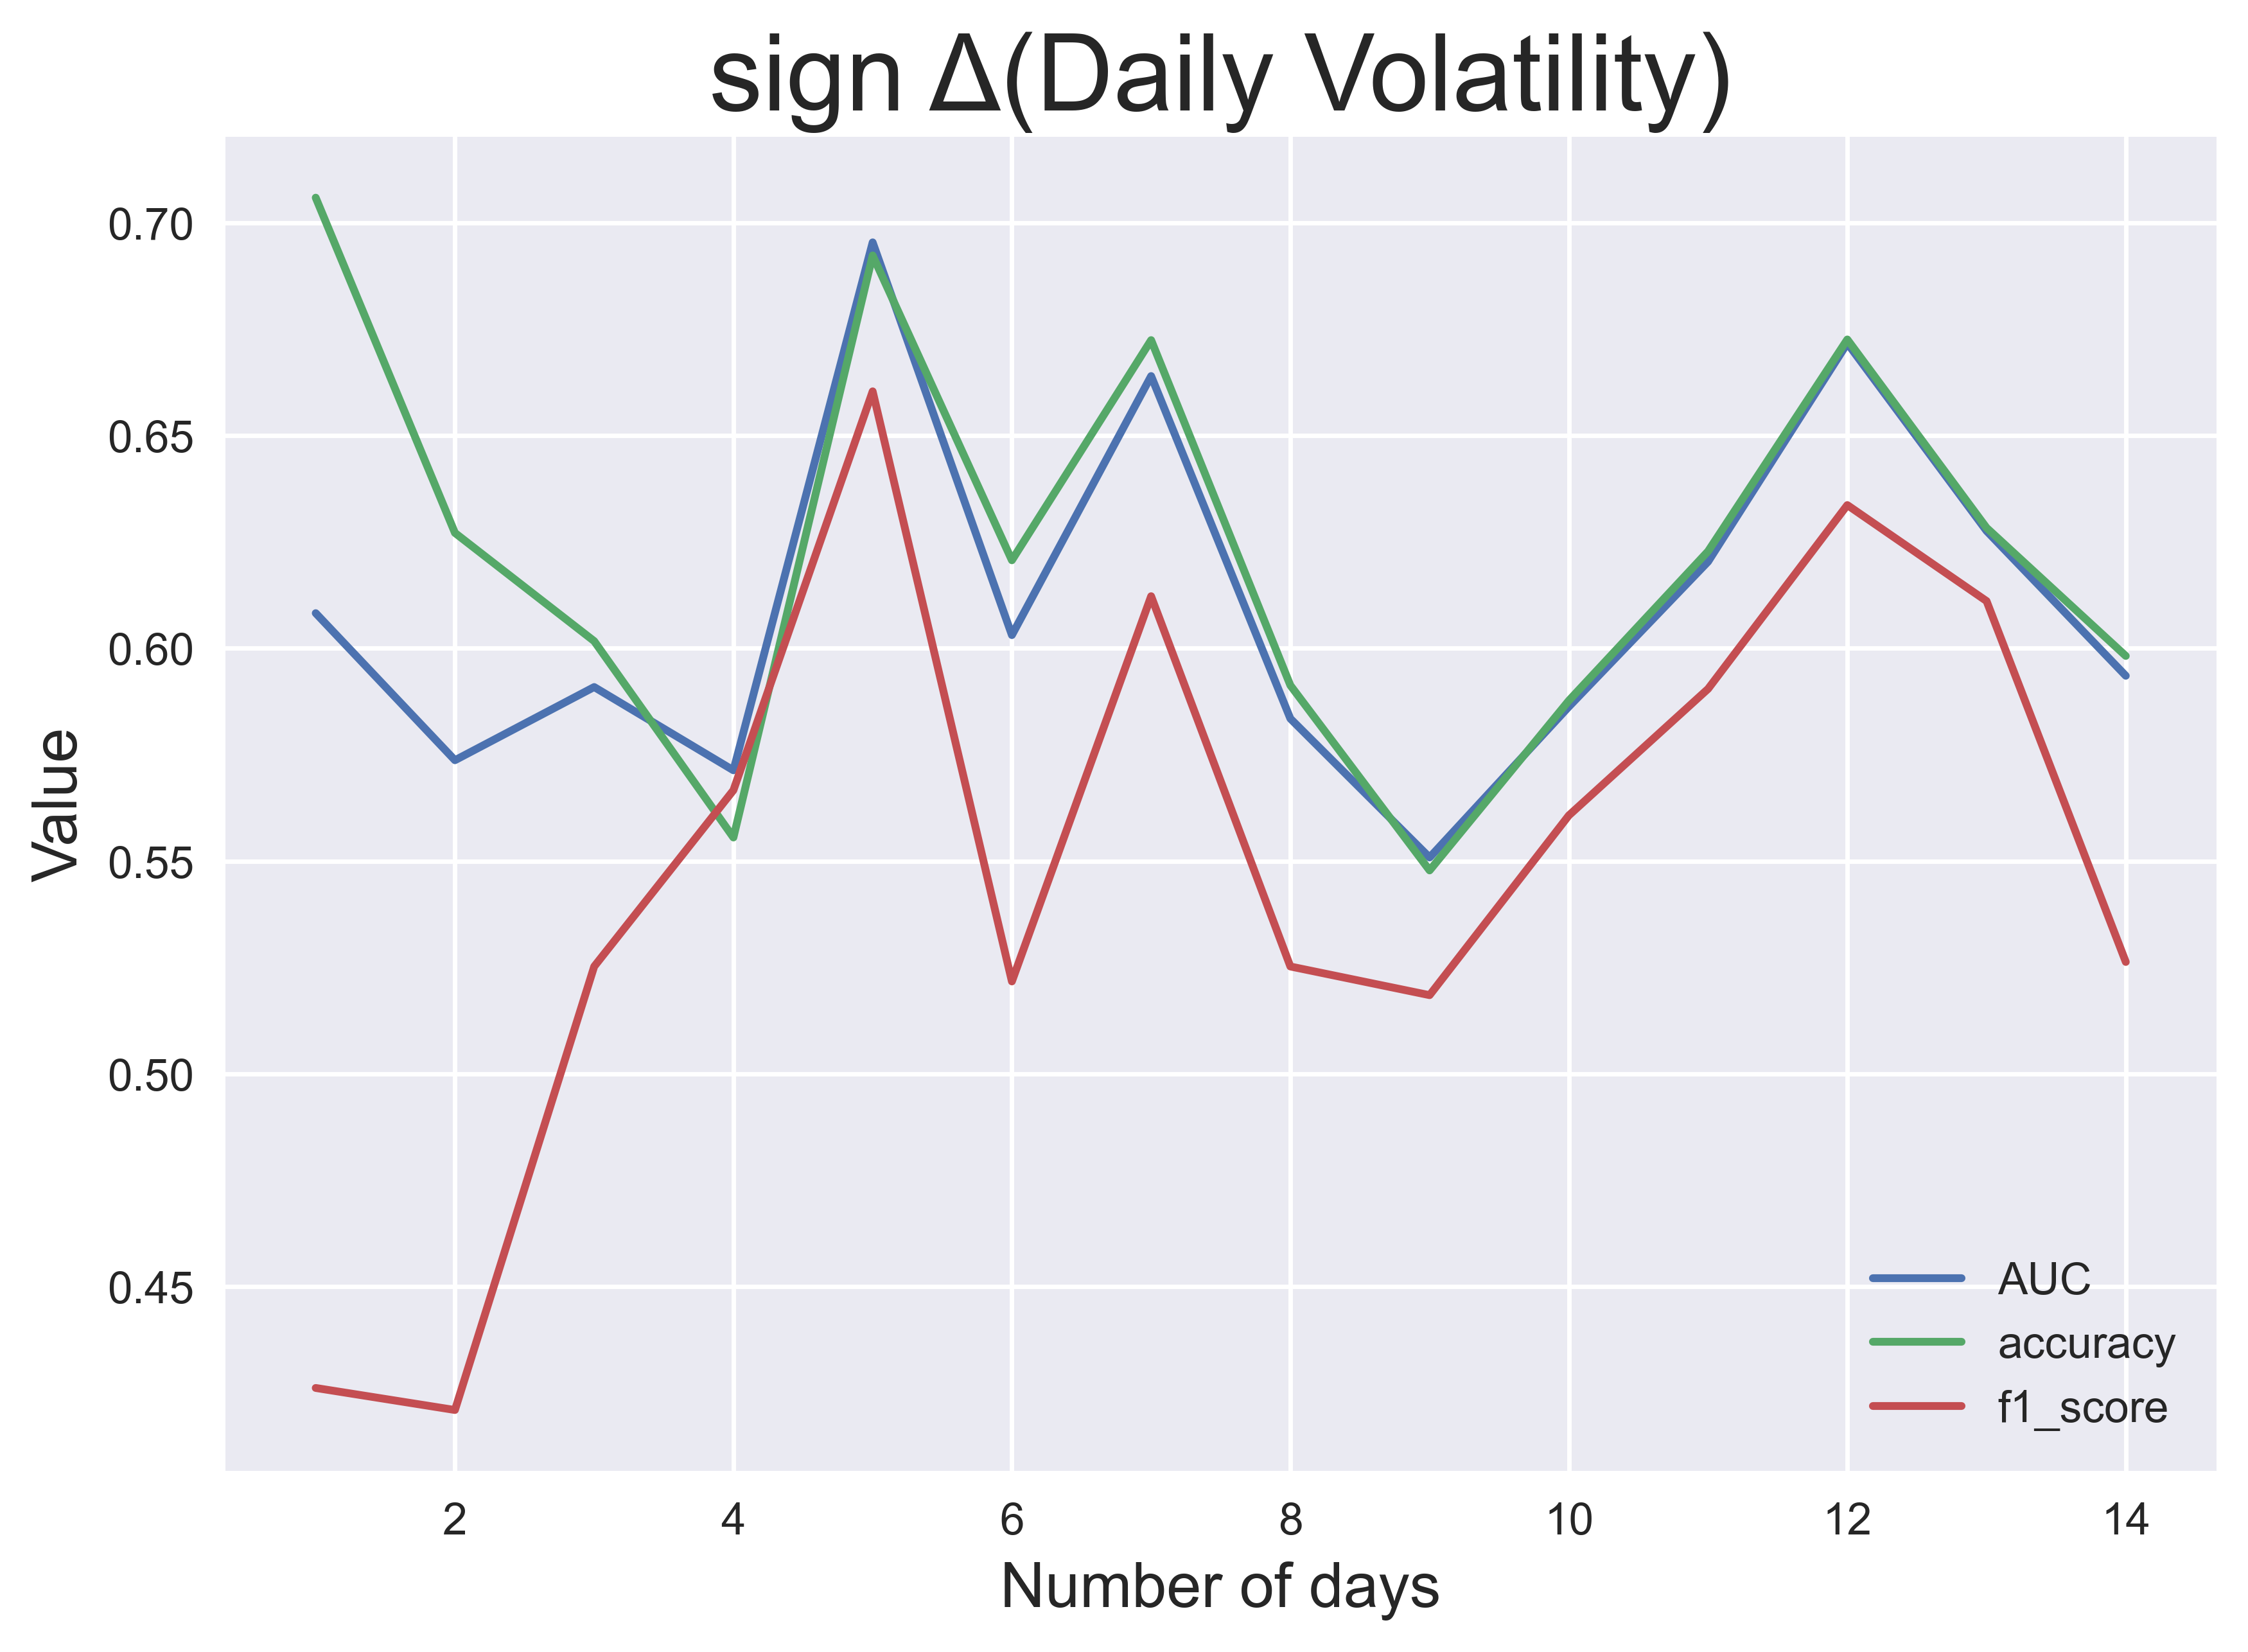
This process was done for each $n$ up to $n=14$ days and each of the four target labels. The pictures above show the classification performance over $n$, measured by three performance metrics: AUC (area under the receiving operating characteristic), classification accuracy and $f_1$ score. From these results, I observe that the performance of the models is generally better for larger windows except for the daily return and volatility.
Explanation: What features mattered?
To examine how features contribute to the prediction, I generate the SHAP values for each classifier. SHAP is a game-theoretic approach to understand the impact that each feature has on a model. Overall, the features have a different effect on estimating different targets. A number of features are shown to carry more predictive information than sentiment score. What this result indicates to us is that you can do much more than just performing sentiment analysis on this dataset.
Conclusion
Based on the above, our analysis suggests that sentiment score is not necessarily the most important feature for stock price modelling. From this feature engineering experiment, I have managed to create 23 features, which can be useful to evaluate the performance of stocks. The main conclusion is that there are always other ways to improve our forecasting, whether it be additional data, features, analysis or experiments. So what can Twitter really tell us about stock prices? The simple answer is a lot more than sentiment analysis which is what the literature suggests. Alternatively, perhaps we should also ask another question which is, what more can we do with this realisation and how do we make our study more meaningful? The possibilities are endless.