
Momentum strategies exploit the tendency of a continued persistence in a stock’s price trend. Academic research conducted across markets, sectors and periods illustrates that momentum based investment strategies generate a consistent, positive return over a full market cycle and have a low correlation with other premia, mainly value. This combination makes investment approaches harnessing momentum structural market opportunities attractive from both a return as well as a diversification standpoint.
INSIGHTS Research
Momentum strategies are often categorised into two groups: cross-sectional momentum and time-series momentum.
Background
Momentum investing is a strategy that seeks to generate a return by investing in stocks based on their historic price trend. It is essentially grounded on the empirically-backed principle that winners in the stock market will continue to win in the short-term.
Momentum was first discovered by Jagadeesh and Titman in the 1993 paper; “Returns to Buying Winners and Selling Losers: Implications for Stock Market Efficiency”. The paper found that the best performing stocks in the US equity market outperformed the worst performing stocks by 1.49% per month. This ‘Winners-Minus-Losers’ premium was subsequently adopted by Mark Carhart in his renowned 4-factor momentum model[1] several years later. In looking at 30 years of equity mutual fund data, Carhart proved that the momentum premium was robust to well-known return-influencing variables such as market cycle, size of firm and value of asset.
Momentum strategies are often categorised into two groups: cross-sectional momentum and time-series momentum. The former explains momentum on a relative basis, comparing the performance of a stock to its peer group, whilst the latter explains momentum based upon the absolute trend of a stock price. Although different in their approach, the article places both groups in the same broad bucket of momentum following strategies.
In analysing momentum’s historic behaviour, Barroso and Santa Clara (2014) find that despite momentum strategies being volatile and characterized by tail risks, the momentum premium consistently delivers a significant return over a full market cycle and outperforms the value and size factors on a risk-adjusted basis.
Rationale
In finance, a return in excess of the risk-free rate is labelled as a premium. Two schools of thought offer explanations as what drives this return – the risk-based argument and the behavioural argument.
While the risk-based argument supports the conventional notion that a return premium is the reward for bearing additional investment risk, the behavioural approach stands in contrast, arguing that it is possible to generate a return by exploiting short-term inefficiencies in the market.
Evidence of the behavioural approach, which can be traced back to Kahneman and Tversky’s 1979 paper, “Prospect Theory: An Analysis of Decision under Risk”, has given rise to quantitative strategies which seek to earn an investment return through capitalising on the inefficiencies in the way investors behave.
One example often used as rationale for momentum existing is the phenomenon of ‘investor herding’. This states that the persistence in stock price is driven by investors following what the rest of the market is investing in, due to fear of missing out, rather than basing investment decisions off their own financial analysis.
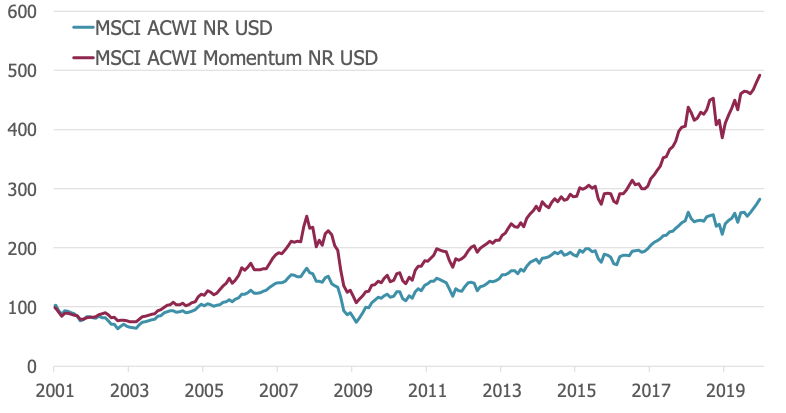
Figure 1: Cumulative Performance, MSCI ACWI NR vs MSCI ACWI Momentum Jan01-Dec19, Source: Morningstar
Evidence
Momentum strategies have historically outperformed the market. An example being the relative performance of the MSCI ACWI Momentum Index compared to its parent index, the MSCI ACWI Index. By identifying and selecting the best c.20% of stocks in terms of momentum from the parent index, it has delivered an additional return of +3.13% p.a. from 2001 – 2019. The figure illustrates a cumulative return graph comparing the performance of both indices since January 2001.
Another appealing characteristic of momentum’s historical performance is its low correlation to value stocks. In Asness’s (et al. 2013) paper “Value and Momentum Everywhere”, a value-momentum correlation of -0.49 was realised between January 1972 and July 2011. This led the paper to conclude that value and momentum present as a strong duo in any asset allocation.
However, momentum strategies tend to require persistent, established, trends in prices. Consequently, funds adopting such strategies do not function well in times of rapid market reversals. This was observed in September 2019, where a sudden repricing of recession risk stemming from a cut in the US Fed policy rate caused the sharpest factor rotation in a decade as investors moved from the previously trending defensive stocks to the undervalued cyclicals (Seeking Alpha, 2019).
This recent performance has led many investors to question momentum strategies. However, the perfect timing of any investment approach is unrealistic (Ilmanen et al.), and we encourage investors to focus on whether the strategy is behaving as expected, and how the strategy fits in their portfolio and investment objectives.
In analysing momentum’s historic behaviour, Barroso and Santa Clara (2014) find that despite momentum strategies being volatile and characterized by tail risks, the momentum premium consistently delivers a significant return over a full market cycle and outperforms the value and size factors on a risk-adjusted basis. Furthermore, the paper found a much larger premium for those strategies which were able to successfully reduce momentum’s tail risk by using a risk management approach.
A well-defined systematic approach capable of producing a positive expected return after controlling for transaction costs is essential for harvesting the momentum premium.
Implementation
Whilst momentum’s positive performance and correlation profile makes it an attractive investment premium, much discussion revolves around the ability to effectively measure momentum in stock prices as well as the trading costs associated with the high turnover strategy, labelling implementation as the true cost of momentum.
We argue this is where the merit of the manager comes into play. A well-defined systematic approach capable of producing a positive expected return after controlling for transaction costs is essential for harvesting the momentum premium.
At Arabesque, we measure a stock’s momentum using a proprietary technology initially developed at Barclays Capital. In its approach, 40 uptrend indicators are combined with 40 downtrend indicators of momentum to calculate 1,600 trend signals for each stock in our investment universe. These trend signals are then ranked based on the extent to which they can effectively capture when a stock is in an uptrend or a downtrend. On a monthly basis, the combination of 4 trend signals for each stock in our investment universe which have historically performed best in collectively capturing the stock’s momentum are used in order to calculate the momentum of each stock on a scale from 0 to 1. Such a multi-dimensional approach is essential for capturing the varying forms price momentum exhibits in the market.
We believe that any strategy capable of harvesting momentum whilst minimising tail risk via effective risk management is attractive both in risk-adjusted terms as well as from a diversification perspective.
References
Jegadeesh, N., Titman, S., Returns to Buying Winners and Selling Losers: Implications for Stock Market Efficiency, 1993 (link)
Carhart, M., On Persistence in Mutual Fund Performance, 1997 (link)
Kahneman, D., Tversky, A., Prospect Theory: An Analysis of Decision under Risk, 1979 (link)
Asness, C., Moskowitz, T., Heje Pedersen, A., Value and Momentum Everywhere, 2013 (link)
Seeking Alpha, Value Picks Crush Momentum In First Major Reversal Since 2009: What’s Next, 2019 (link)
Barroso, P., Santa-Clara, P., Momentum has its moments, 2014 (link)
Ilmanen, Antti S. and Israel, Ronen and Moskowitz, Tobias J. and
Thapar, Ashwin K and Wang, Franklin, How Do Factor Premia Vary Over Time? A
Century of Evidence (December 18, 2019).
[1] An amended version of the Fama-French 3-Factor model with the addition of the ‘WML’ factor.